Showing posts with label lohas. Show all posts

Monday, December 18, 2006

Healthiest Regions in the U.S.

It is not hard to see why Green Entrepreneurs might be interested in public health studies. Organic products + love for the environment and outdoors + interest in wellness and healthy living, definitely helps raise the health of any community. The important LOHAS market segment can help nurture products and technologies which could have huge public health benefits.

So what are the healthiest regions int the U.S.? The United Health Foundation conducted a study in 2004, where they measured states along several variables and ranked them using a composite index. To visualize the results, I took the data and generated a heat map. Green signifies a State scored higher than the 50 State average, Red signifies the State scored lower, Black means the State scored about the same as the 50 State average. (To enlarge a particular image, click on it.)
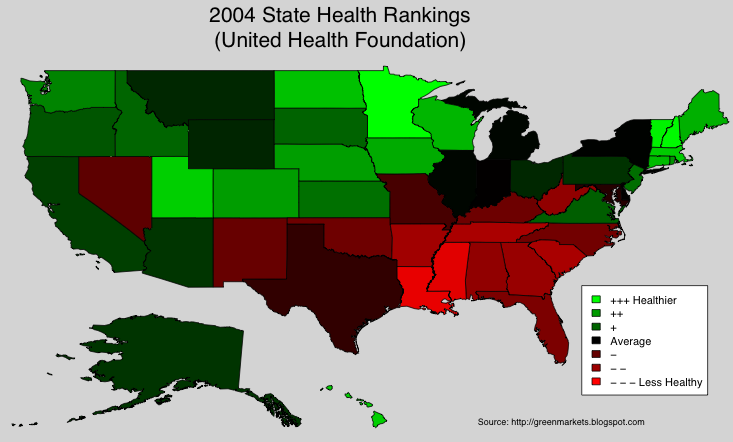
MN finished first: a position it has held 9 out of the last 15 years. NH, VT, HI and UT roundup the top five states. States in the Southeast consistently scored below the 50 State average. I have heard factoids that the Southern states lag the rest of the country in terms of income levels. But I have to admit the map still surpised me. These red colored states await Green Entrepreneurs and solutions.

I wanted to "drill-down" into major cities in each state, but alas, I was unable to find data at the city level. Wanting "city-level" data, I decided to look at this ranking of the 50 largest U.S. cities, put together by a different organization (Centrum). Actually, Centrum ranked Metro Areas (or SMSA's), and they used the 2003 estimated population to come up with the 50 largest. Just like any "ranking" or "survey", this one has it's flaws, but Centrum was quite transparent about the data sources and metrics used in the study. The data came from mostly public sources. In coloring a specific Metro Area, I included counties that are part of the Metro Area: in some instances this might show Metro Areas crossing state lines.

The Overall Score and Ranking, is based on a weighted composite scores across several dimensions. (To enlarge a particular image, click on it. Feel free to use these maps.)
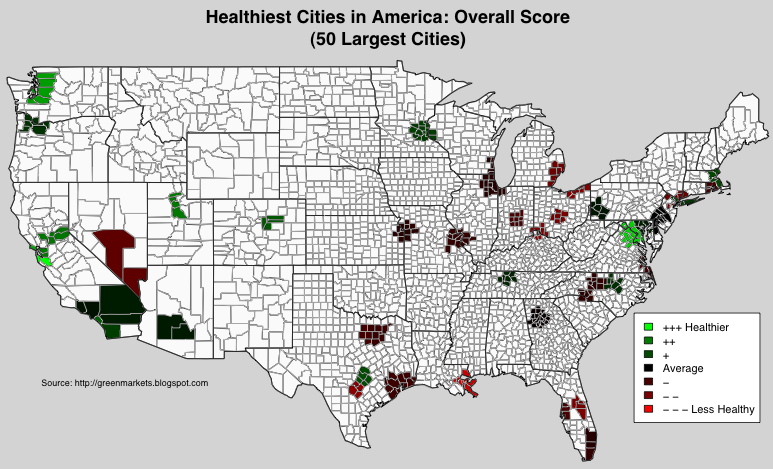

I thought the scores in the individual dimensions were interesting. For each dimension, the average score is equal to the (percentile) median: 50.

Mental Wellness was based on the following criteria.
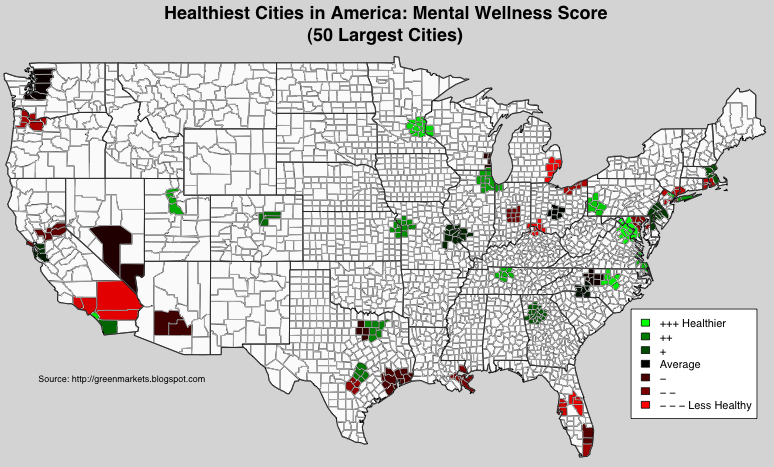

I see that the West Coast is a prime market for stress relief solutions. Washington, DC scored the highest -- but they mean the residents of DC and not Congress!

Lifestyle Pursuits was based on the following criteria.
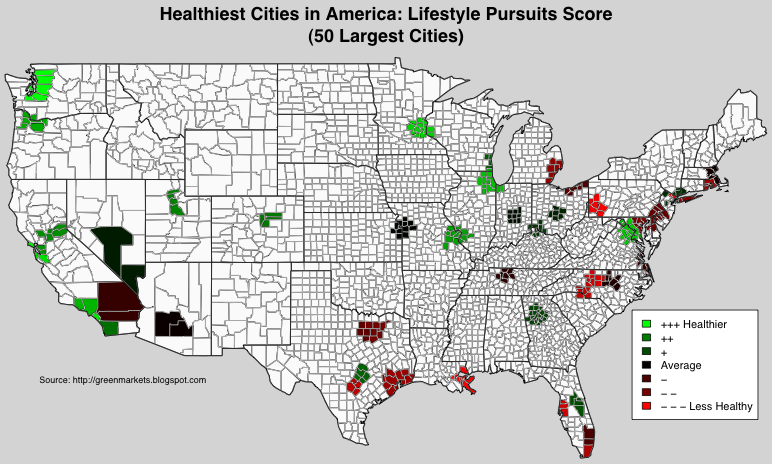

One can argue with the choice of "lifestyle pursuits" calling into question the stability of the results: different "lifestyle pursuits" would probably result in a very different map.

Physical Activity was based on the following criteria.
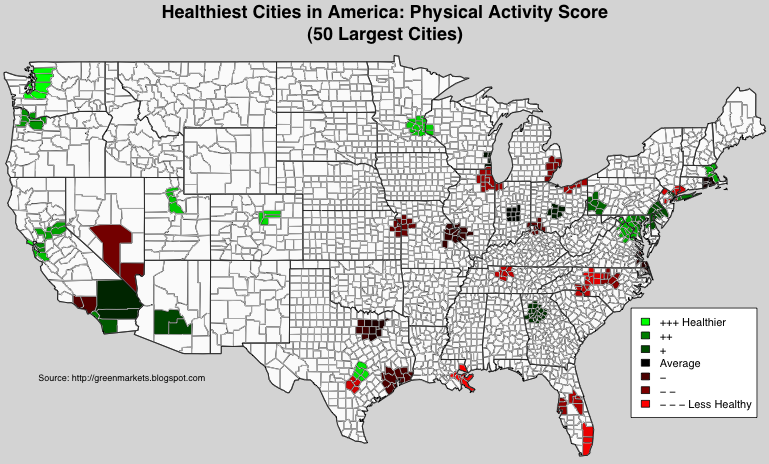

L.A. and South Florida finished lower than I expected: that blows our beach culture stereotype. Miami finished near the bottom. If they included Yoga, L.A. would be bright green!

Health Status was based on the following criteria.
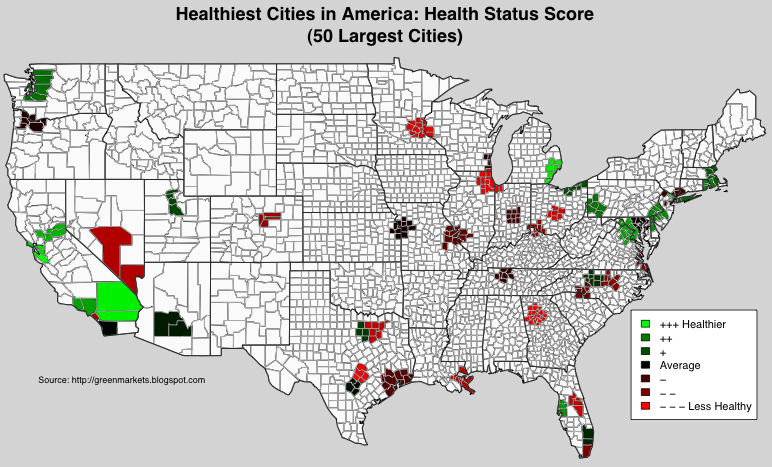

These results seem to coincide somewhat with the State rankings above. Michigan which has finished #1 in the Unite Health rankings for 9 out of the last 15 years, is represented by Detroit, which is near the top in this metric.

Nutrition was based on the following criteria.


The Northern states fared poorly, possibly due to higher alcohol consumption and lack of year-round access to fresh fruits and vegetables.

Summary: The non-profit United Health Foundation's State Health rankings reveals opportunities for Green Entrepreneurs and activists based in the Southeastern states. Drilling-down to Metro Areas, I was unable to find city-level data from United Health, and turned to Metro Area rankings from a separate study.

Monday, November 27, 2006

Whole Foods Locations

Whole Foods is the big player in Organic groceries, and arguably, for the entire LOHAS Industry (Lifestyles of Health and Sustainability). I will be devoting some future posts to understanding Whole Foods. With a market cap of $6.7B and no signs of slowing down, Whole Foods has tried to stay true to its values, inspite of its rapid growth.

To understand the market for Green products, it is good to know how Whole Foods selects it's store locations. Whole Foods stores tend to be located in upper income, liberal leaning enclaves. As green products become more mainstream and affordable, will we see Whole Foods expand beyond their current geographic areas?

Here is a map of Whole Foods stores in the mainland U.S. I aggregated stores by county: LA county has the highest number of Whole Foods stores. (To enlarge, Click on an image.)


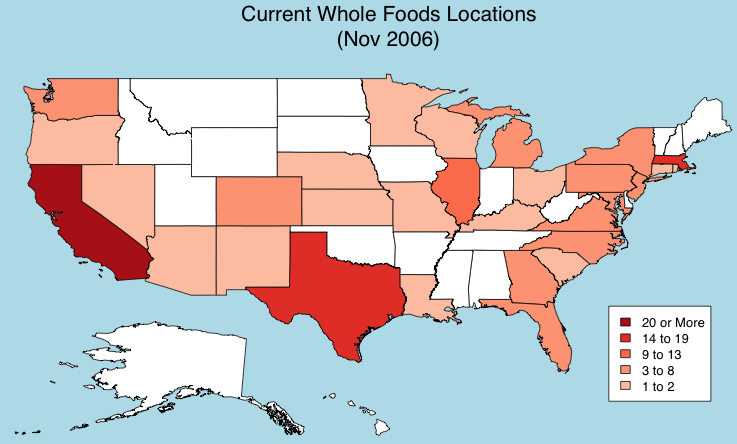
One can also aggregate the number of active locations by State:


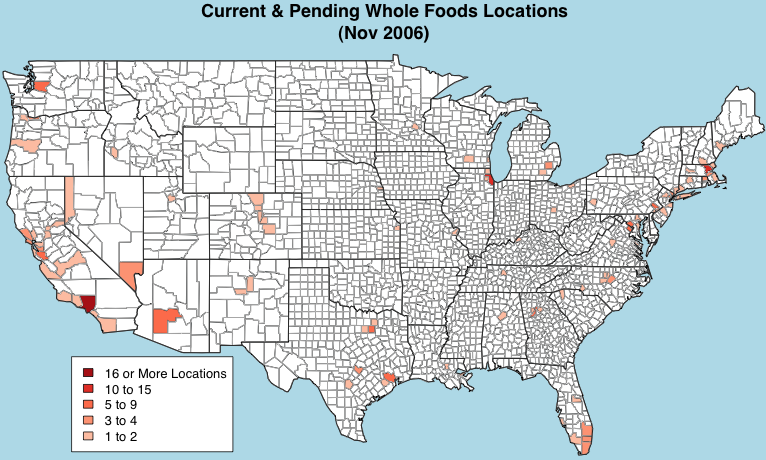
In these next maps I added stores currently in development. The first graph is an aggregate at the county level, and the second graph is an aggregate at the state level:


Illinois is joining Texas and Massachusetts with just below 20 active and pending locations, most of the stores serve the Chicago metro area. California is far and away their biggest market, further cementing the state's reputation for being at the leading edge of lifestyle trends.

At this time, Whole Foods is expanding carefully, and is generally sticking to the same metro areas. The market for organic foods is growing, and I have to believe there is an opportunity for someone to capture this market in the states & metro areas that Whole Foods is currently ignoring. Will Wild Oats dominate, or will the "mainstream" grocery chains slowly capture the market for Organic foods, in these other regions? From a logistics and distribution POV, the mainstream grocers who are already in these regions can easily expand their offerings of Organics foods. So how does Whole foods keep growing at a rate to make its investors happy? I think their strategy is clearly to keep adding to their current locations, and to take advantage of their scale and distribution centers.

Monday, November 20, 2006

2006 SF Greenfest: Exhibitor Analysis

Walking around the recent SF Green Festival (Greenfest), I was struck by the number and variety of exhibitors. The festival keeps growing, and this year, the Concourse really felt crowded. Who were the exhibitors? The resulting analysis is based on data from the festival's own listings, which I supplemented with descriptions from the exhibitors' web sites. I was interested in uncovering the common "themes or topics" in this year's festival.

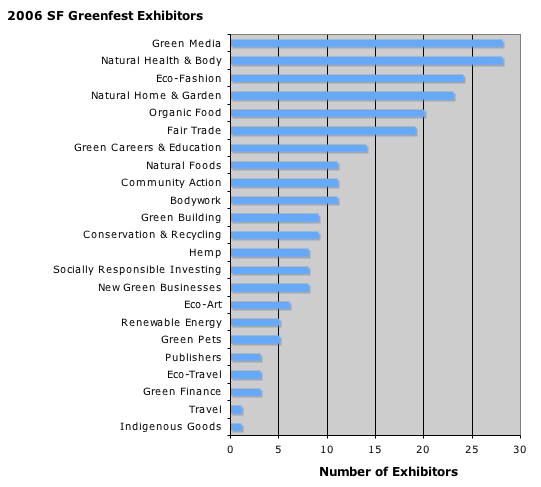
First some simple counts: there were 236 exhibitors across 23 categories, with some exhibitors listed in more than one category:


The graph confirms my experience while walking around the festival: there were a lot of publishers, clothing, and health and beauty products. It was a San Francisco festival, so it is not a surprise that most of the exhibitors were from California:


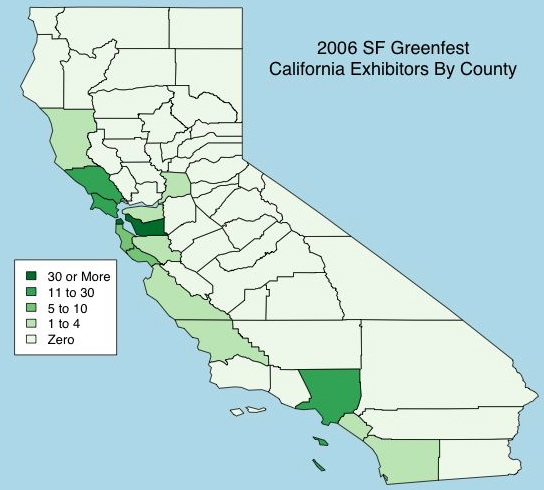
Most of the exhibitors were from the West Coast: California (148), Oregon (17), and Washington (12). Within California, San Francisco (45) and Alameda (31) counties were dominant:


If I were an organizer, I would try to increase the number of exhibitors from the Peninsula (San Mateo and Santa Clara), and help nurture Green Entrepreneurs in those nearby counties. Having more exhibitors from the Peninsula would also increase attendance from Silicon Valley.

Topics and Themes
The Festival was ground zero for the LOHAS Industry (Lifestyles of Health and Sustainability): I was interested in how companies appeal to members of this growing space. I decided to use Exhibitors' own company statements/descriptions/philosophies to see if there were any dominant themes and topics. If one wants to understand this segment, one might as well understand how the Green Entrepreneurs position themselves in the marketplace!

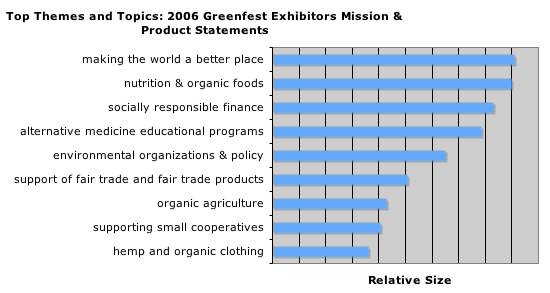
Using recent developments in (unsupervised) machine learning and bayesian computation, an analyst can now analyze text data to uncover latent topics. I started with the descriptions provided by the exhibitors, and supplemented it with descriptions from an exhibitor's own web site, whenever I felt that I needed a longer "mission or product statement". Using a text mining algorithm, I uncovered 25 themes/topics from the exhibitors' "mission or product statements". An interesting output of the algorithm, is that any individual "mission or product statement" can cover one or more topics. As an example, a Fair Trade coffee maker can talk about Fair Trade, the environment, and organic agriculture. Finally, one can measure the relative size of the different topics:

"making the world a better place" and "nutrition & organic foods" were the two most common topics discussed: if one were to examine the "missions & product statements" of the 200+ exhibitors, these are the two most commonly mentioned subjects. The one caveat about the size of topics: size is measured by the amount of text devoted to a topic. In the course of supplementing text for certain exhibitors, I may have inadvertently added to the size of certain topics. I suspect that's what happened in the case of "socially responsible finance".

Conclusion
The SF Green Festival continues to grow, and this year included 236 participating exhibitors. Since the conference was held in SF, most of the exhibitors came from the West Coast. Among California exhibitors, SF and Alameda county were dominant. For 2007, I recommend the festival organizers try to recruit more exhibitors from nearby San Mateo and Santa Clara counties.

Using a text mining algorithm, we studied themes and topics used in the exhibitors "mission and product statements". A similar and more thorough analysis may be useful to marketers in the fast-growing LOHAS Industry (Lifestyles of Health and Sustainability).