Showing posts with label co2 emissions. Show all posts

Wednesday, June 13, 2007

No Longer A Waste: Energy and Recycling

The Economist had a recent article on municipal curbside recycling which laid to rest the question of whether recycling is good for the environment. Recycling involves trucks, other machinery and energy inputs, so a valid question is whether or not the amount of materials extracted justifies the amount of energy used in the process. Using the results from a recent study sponsored by the UK-based Waste & Resources Action Programme, the answer is recycling DEFINITELY pays off. The study is essentially a meta-analysis of about 55 respected Life Cycle Analyses from several countries.
The UK’s current recycling of those materials saves between 10-15 million tonnes of CO2 equivalents per year compared to applying the current mix of landfill and incineration with energy recovery to the same materials. This is equivalent to about 10% of the annual CO2 emissions from the transport sector, and equates to taking 3.5 million cars off UK roads. ... The message for policy makers and practitioners is unequivocal. Recycling is good for the environment, saves energy, reduces raw material extraction and combats climate change.
The article also includes interesting factoids, along with several graphs and metrics.


The above graph is based on data from the OECD. Recycling Rates are defined to be the total (weight in tons) of all Recycled Municipal Solid Waste (MSW) as a percentage of Total MSW. In recent years, single-stream or co-mingled recycling has been used successfully to boost recycling rates. In single-stream recycling, a single recycling bin is provided and materials are separated by the recycling facilities. With an extremely high recycling rate of 69%, San Francisco is one of the most successful single-stream recyclers around. Through a combination of human and machine-automated separation techniques (Eddy-current separators), SF "... processes an average of 750 tons of paper, plastic, glass and metals a day."

I used the colorfully titled 2006 State of Garbage in America to get a snapshot of the recycling rates by state. As a secondary metric, I will also look at the percentage of total MSW (municipal solid waste) which ends up in landfills. Using this metric, the Rocky Mountain Region performed horribly, with 86% of all MSW ending up in landfills:


In New England, 36% of MSW is converted to energy thus only 35% of total MSW ends up in landfills. After recyclable materials are separated, the remaining suitable MSW are combusted and the heat generated is used to power steam turbines that generate electricity. In a previous post, I compared sources of electricity for a few key countries and noted that Denmark generates 3.6% of its electricity using MSW. These Waste-to-Energy facilities do create emissions, but the EPA considers the emissions from these primarily biomass derived materials, to be part of the "Earth's natural carbon cycle". Because of the variation in Waste-to-Energy facilities, there are possibly other environmental problems that accompany such facilities.

I loaded the data and mapped the results at the State level. For recycling rates, higher rates are desirable. The West Coast states (CA, OR, WA) all recycled at least 40% of their total MSW:


I'm astounded that in the year 2006, there are still states with single-digit recycling rates!

For the percentage of total of MSW which ends up in landfills, lower rates are desirable. The New England States convert a large percentage of their MSW to energy so they have lower percentages ending up in landfills:


CT converted a whopping 65% of its MSW to energy! To the extent that the low Landfill rates are driven by high Waste-to-Energy conversion rates, further studies on the environmental impact of such facilities should be conducted.

Digg It! , Bookmark to del.icio.us , My Yahoo! , ATOM Feed

Monday, January 29, 2007

U.S. CO2 Emissions by Sector and State

Lowering CO2 emissions is increasingly becoming a goal of Corporate America. The CEO's of 10 major corporations are calling on the Bush administration and Congress to pass some " ... serious global warming legislation as quickly as possible." Evangelical Christians, an important constituency inside the Republican party, are also beginning to take environmental issues more seriously. Throw in the 2008 Presidential primaries early next year, and this could be the year of serious global warming legislation.

So what are the primary sources of CO2 emissions in the U.S.? What states and regions have the highest CO2 emissions per capita? I turned to data published by the Environmental Protection Agency (EPA). The EPA data spans 1990-2003, and is broken down by "sector". While composing this post I came across similar data (Wall St. Journal, subscription required) from the International Energy Agency (IEA).

(To enlarge a particular image, click on it.) In the U.S., 33% of CO2 emissions come from the Transportation sector, world-wide, Transporation accounts for only 20%. Americans tend to drive less fuel-efficient vehicles, and tend to drive more miles. Interestingly, while the fast-growing economies of India and China are increasing their share of emissions from the Transportation sector, the U.S. seems to be trending towards less driving, and lighter and more fuel-efficient cars. With the growing popularity of hybrids, bio-diesel, and the possibility of plug-in hybrids, I expect the Transportation sector in the U.S. to see large reductions in the next decade. The other notable difference: the U.S. Residential sector accounts for about 7% of CO2 emissions, compared to 13% world-wide.

Which sectors have shown the fastest growth from 1990-2003? Again we normalize all the time-series, so they start at a common value (say 100), then use their respective year-over-year growth rates to plot the rest of the graph:

From 1990-2003, emissions from the Electric Power and Transportation sectors grew 24% and 20% respectively. Not only are these the largest sources of CO2 emissions (accounting for 71% of total emissions in 2003), they are also the fastest-growing. Policy-makers in the bellwether state of California have long focused their efforts on these sectors, and recently two key initiatives garnered bi-partisan support: utilities must produce 20% of their electricity from renewable sources by 2010 AND refineries and gas stations must reduce by 20% the carbon content of fuel they sell by 2020. As the " ... world's ninth largest emitter of the greenhouse gases that trap heat in the atmosphere", California is ground zero for innovation in renewable energy.

In the U.S., emissions from the Industrial sector declined by 5% from 1990-2003. This drop is probably a reflection of the fact that the U.S. manufacturing sector has declined significantly during that time period.

Finally we use heat maps to present state level emissions. To account for the size of a state, we compare emissions-per-capita. Our benchmark will be the U.S. per capita emissions: Green means a state has lower per capita emissions than the U.S., Red means it has higher emissions per capita.

In 2003, Wyoming had the highest TOTAL CO2 emissions per capita. The above map is somewhat reminiscent of the 2004 Presidential Electoral College map :-)

Next we examine state level emissions data for the two largest sources of CO2 emissions in the U.S. (Electric Power and Transportation).

The Western states rely more on hydro-electric power compared to the rest of the country. The "red" states are most likely those that lean heavily on coal powered plants. In a previous post, I highlighted the fact that California used the least amount of electricity per capita. In the graph below, we look at a simple linear relationship, between electricity consumption per-capita AND per capita CO2 emissions due to electric power:

WY, ND, WV are states whose per capita CO2 emissions are high relative to their per capita electricity consumption. These are states whose electric power comes largely from coal powered plants.

Turning to the Transportation sector:

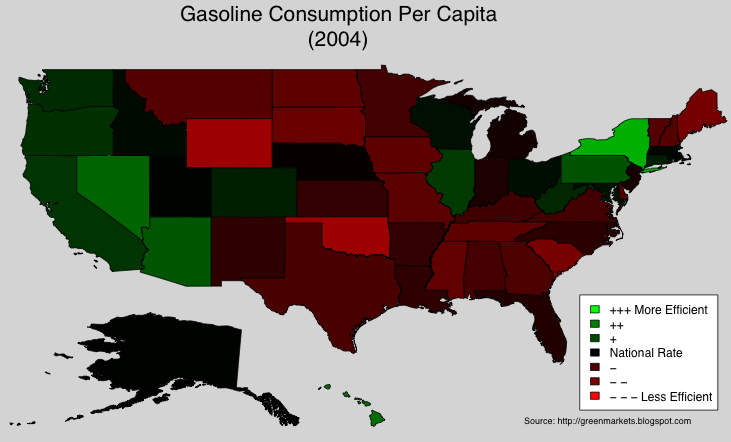
We expect California (home to over 1 in 10 new cars sold in the U.S.) to be about average, and the Northeast (home to mass transit) to have less emissions per capita. In a previous post, I noted that California is among the states that used the LEAST amount of gasoline per capita (here is a map). Below is a scatterplot of 2004 Gasoline consumption per capita vs. 2003 CO2 Emissions from Transportation. Unfortunately, data for the variables represent two different years:

Using this "weak" linear relationship, we uncovered some interesing outliers: AK, WY, and to a lesser extent HI and LA. These states have CO2 emissions (from Transportation) higher than what one would expect from their repective per capita gasoline consumption. AK is a huge state, and transportation between some areas is limited: to get to the state capital you have to fly or take a ferry! I suspect that gasoline consumption-per-capita is largely based on data from gas stations, while the Transportation emissions-per-capita captures more forms of transportation.

Sound energy policy pays off relatively quickly. Consider the case of California:


Power use per person has remained roughly stable in the state since the 1970s, even as it has doubled in the rest of the country (see chart above). As a result, California's greenhouse-gas emissions per person are on a par with those of Denmark. Relative to the size of its economy, they are lower.
In the next few weeks, I will try to focus on the Transportation and Electric Utility sectors: the reasons behind the high amounts of emissions, and the solutions currently being developed.

UPDATE: The SJ Mercury News has a great article on the steps California took to become the most energy efficient state in the US.

Digg It! , Bookmark to del.icio.us