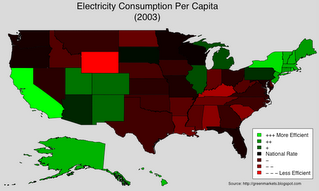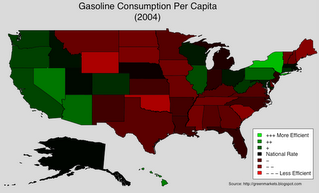
Wanting a different visual for these consumption rates, I took the data and generated corresponding heat maps. In the next two maps, Green signifies a state consumes less (per capita) compared to the U.S. Per Capita Rate, Red signifies the state consumes more per capita than the nation, Black means the state consumes about the same amount of energy per capita as the entire nation.
In terms of per capita electricity consumption, CA is the most efficient. Is this partly due to the adjustments the state made in response to the 2000-2001 energy crisis?

The answer is, mostly no: the NY Times also featured a graphic which showed that California's per capita electricity consumption has more or less been flat since the late 1970s. While the development of renewables is crucial, efficiency and conservation are just as important. The market for "green" energy solutions includes efficient appliances and other technologies which help people consume less energy. The map above highlights vast untapped markets for such solutions.
The gasoline consumption data shows that the West and the Northeast, are once again, more efficient than the National Average:

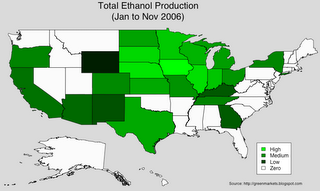
High gasoline usage is probably due to the use of farm equipment and trucks. As we next show, some of the gas guzzling states are the leading producers of (corn based) ethanol.
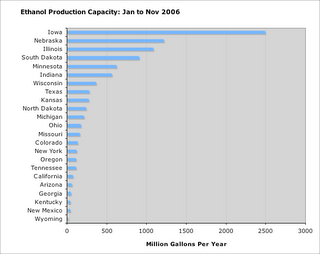
According to the DOE, current average energy yield for corn based ethanol is 25% ("... 25 percent more energy than is used in growing the corn, harvesting it, and distilling it into ethanol"). Most of the ethanol produced in the U.S. is from corn, so it is no suprise that the Midwest dominates:


As cellulosic ethanol becomes more common, I expect the rest of the country to ramp up their production.
The Energy Policy Act of 1992 considers E85 (85% ethanol, 15% gasoline) and blends with even higher concentration of ethanol to be "alternative" fuels. Which states use the most E85 gas? A proxy for consumption of E85 is the number of E85 fueling stations available from the DOE (if you can't pump it, you can't use it):

The earlier map showing gasoline consumption per capita gives a list of "green" states where E85 stations would be popular. A gas station owner in these states, can count on positive publicity and a steady stream of customers. As of early December 2006, California has FOUR E85 stations: two of which are in the Lawrence Berkeley Labs!

No comments:
Post a Comment