Showing posts with label organic products. Show all posts

Monday, December 04, 2006

Organic Food Sales and Whole Foods Market

Once can cite a litany of anecdotal evidence showing that sales of Organic Foods in the U.S. is growing fast. For official statistics, the Organic Trade Association conducts regular manufacturers survey, which unfortunately, seems to be available only to members. I was able to track down a copy of the 2004 survey, and what follows are some graphs I've put together using the 2004 survey results. (To enlarge a particular image, click on it.)

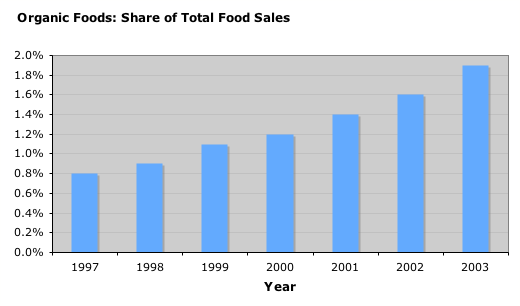
One measure of growth is the increasing share of Organics in overall food sales: from 1997 to 2003, the share of Organics rose from 0.8% to 1.9%, a 138% rise.

Another way to illustrate the growth in Organic Foods is to graph the time series of sales of Organic Foods and all foods. The problem with drawing the graph of these two time series is that the magnitude of the two time series are very different: Organic Food Sales are a small proportion of total food sales. A common trick is to normalize both time series so they start at a common initial value (say 100), then use their respective year-over-year growth rates to plot the rest of the graph. In the graph below we plot 4 times series in this manner:
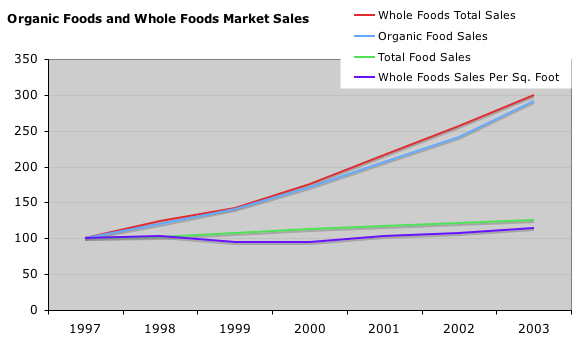

The total sales of Whole Foods Market (organic and conventional, food and non-food items) closely tracks the sales in Organic Foods. The high correlation reflects the importance of Whole Foods within the Organic Foods industry, and the importance of Organic Food sales to Whole Foods' total sales. What the graph suggests is that a rough estimate of the year-over-year growth in Organic Food sales, is the growth in Whole Foods' total sales.

Between 1997 and 2003, Whole Foods sales went up 200%, compared with a 191% growth in Organic Foods. Because of its scale and efficiencies derived from its size, one expects Whole foods to grow slightly faster than the Organic Food industry. If one factors in the growth in Whole Foods retail stores (sales per square foot), Whole Foods grew a more modest 14%. Total food sales grew 25% between 1997 and 2003.

The remaining graphs are drawn from the sales of Organic items in 2003. Which categories are growing the fastest? To address this question we use a treemap. In a treemap, the size of the square reflects the size of the category, while its color reflects the rate-of-change of the category. Green means a category is growing, Black means it is relatively flat, Red means the category is declining. In the following treemaps, the size of a square reflects the 2003 sales in the given category, the color corresponds to the 2003 year-over-year growth. (To enlarge a particular image, click on it.)
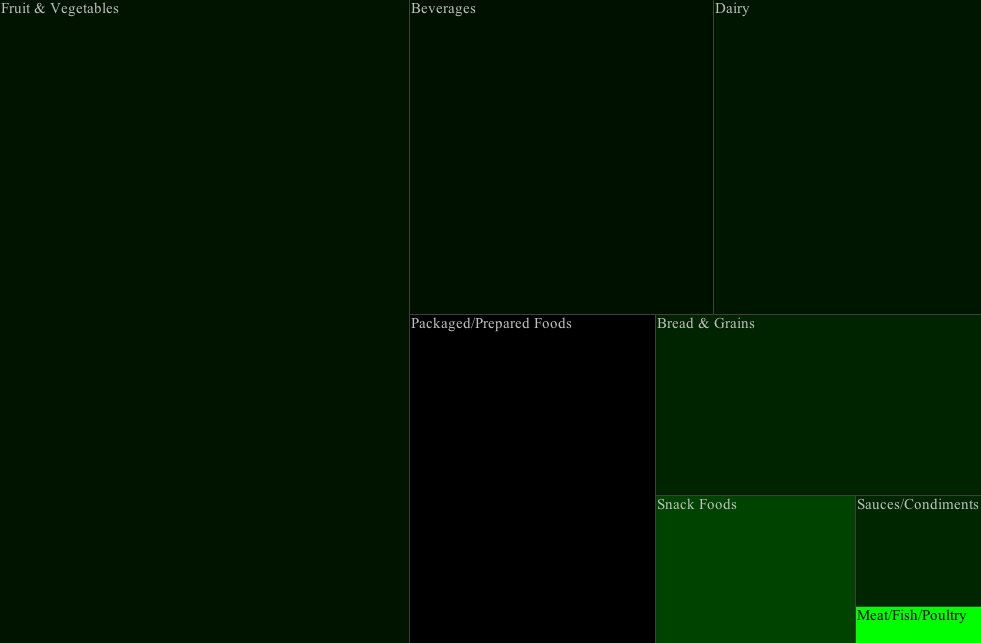

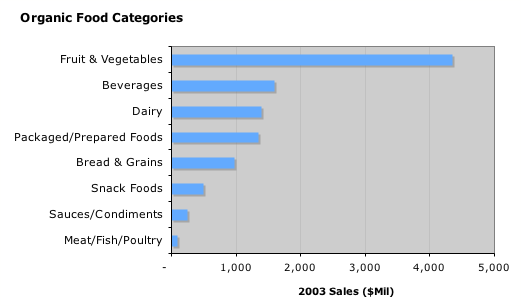
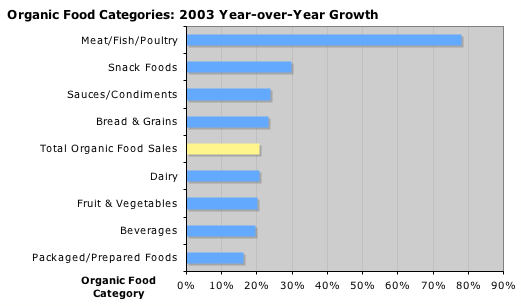
Not suprisingly, the smallest category (Meat/Fish/Poultry) grew the fastest. The advantage of a treemap is that you can encapsulate two pieces of information in one graph: the size of a category and its growth rate. The alternative approach is to use two separate bar charts:


Here is a treemap for the Organic Non-Foods categories:


Finally, here is a 2-level treemap of Organic Foods and Non-Foods, to show the relative sizes and growth rates of all the categories:
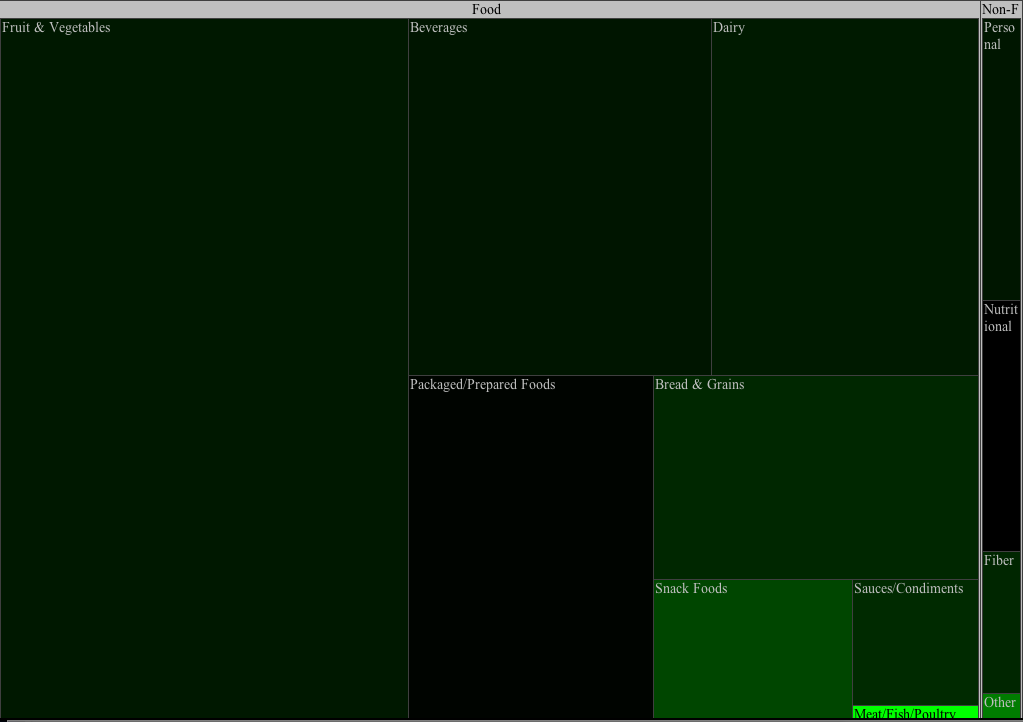

Conclusion: Organic Foods sales are growing much faster than sales of non-organic food products. The share of Organic Foods in overall foods sales more than doubled between 1997 and 2003. Whole Foods Markets total sales, closely tracks the total sales of all Organic Foods: an estimate for the year-over-year growth in the sales of Organic Foods, is the corresponding change in the Total Sales of Whole Foods Market.

Monday, November 20, 2006

2006 SF Greenfest: Exhibitor Analysis

Walking around the recent SF Green Festival (Greenfest), I was struck by the number and variety of exhibitors. The festival keeps growing, and this year, the Concourse really felt crowded. Who were the exhibitors? The resulting analysis is based on data from the festival's own listings, which I supplemented with descriptions from the exhibitors' web sites. I was interested in uncovering the common "themes or topics" in this year's festival.

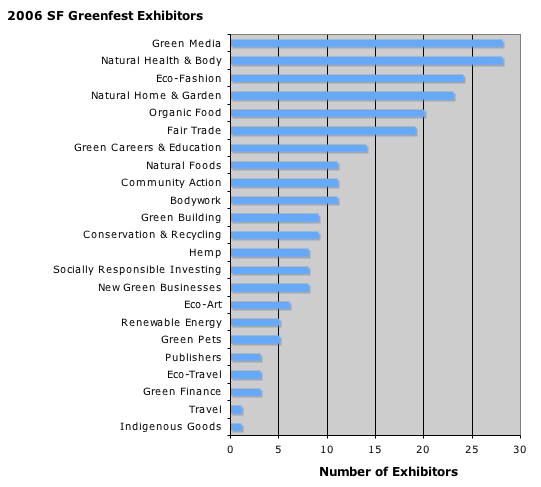
First some simple counts: there were 236 exhibitors across 23 categories, with some exhibitors listed in more than one category:


The graph confirms my experience while walking around the festival: there were a lot of publishers, clothing, and health and beauty products. It was a San Francisco festival, so it is not a surprise that most of the exhibitors were from California:


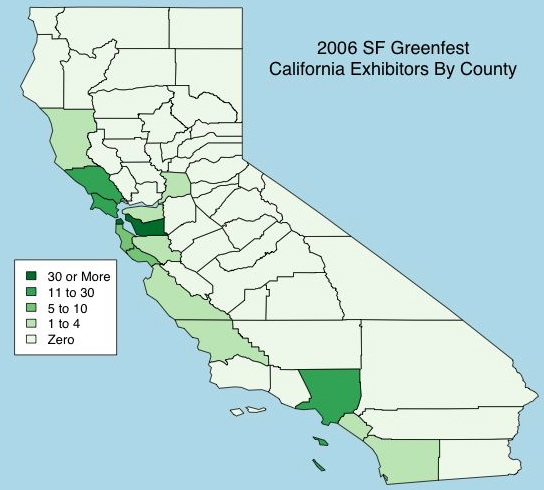
Most of the exhibitors were from the West Coast: California (148), Oregon (17), and Washington (12). Within California, San Francisco (45) and Alameda (31) counties were dominant:


If I were an organizer, I would try to increase the number of exhibitors from the Peninsula (San Mateo and Santa Clara), and help nurture Green Entrepreneurs in those nearby counties. Having more exhibitors from the Peninsula would also increase attendance from Silicon Valley.

Topics and Themes
The Festival was ground zero for the LOHAS Industry (Lifestyles of Health and Sustainability): I was interested in how companies appeal to members of this growing space. I decided to use Exhibitors' own company statements/descriptions/philosophies to see if there were any dominant themes and topics. If one wants to understand this segment, one might as well understand how the Green Entrepreneurs position themselves in the marketplace!

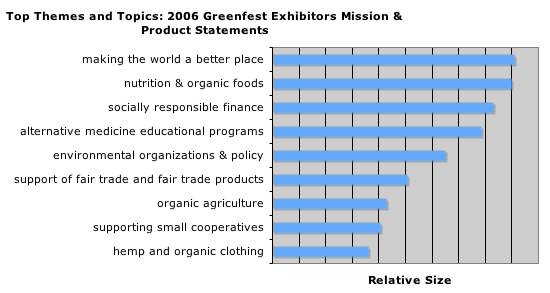
Using recent developments in (unsupervised) machine learning and bayesian computation, an analyst can now analyze text data to uncover latent topics. I started with the descriptions provided by the exhibitors, and supplemented it with descriptions from an exhibitor's own web site, whenever I felt that I needed a longer "mission or product statement". Using a text mining algorithm, I uncovered 25 themes/topics from the exhibitors' "mission or product statements". An interesting output of the algorithm, is that any individual "mission or product statement" can cover one or more topics. As an example, a Fair Trade coffee maker can talk about Fair Trade, the environment, and organic agriculture. Finally, one can measure the relative size of the different topics:

"making the world a better place" and "nutrition & organic foods" were the two most common topics discussed: if one were to examine the "missions & product statements" of the 200+ exhibitors, these are the two most commonly mentioned subjects. The one caveat about the size of topics: size is measured by the amount of text devoted to a topic. In the course of supplementing text for certain exhibitors, I may have inadvertently added to the size of certain topics. I suspect that's what happened in the case of "socially responsible finance".

Conclusion
The SF Green Festival continues to grow, and this year included 236 participating exhibitors. Since the conference was held in SF, most of the exhibitors came from the West Coast. Among California exhibitors, SF and Alameda county were dominant. For 2007, I recommend the festival organizers try to recruit more exhibitors from nearby San Mateo and Santa Clara counties.

Using a text mining algorithm, we studied themes and topics used in the exhibitors "mission and product statements". A similar and more thorough analysis may be useful to marketers in the fast-growing LOHAS Industry (Lifestyles of Health and Sustainability).