Showing posts with label renewable energy. Show all posts

Monday, May 28, 2007

Your State, You, and Kyoto

While the U.S. Goverment has shied away from Renewable Energy mandates, Federalism is alive and well on the energy issue. A recent WSJ article included a "cheatsheet" on the current State-by-State renewable energy targets:


Based on the current level of interest in renewables, I suspect that National legistlation outlining targets for the use of renewables, to be in place by the end of the NEXT administration. Don't be suprised if states like California, continue to move more aggresively and set targets well beyond any Federal mandates. States (and cities) realize that Clean Tech companies are going to generate a lot of high-paying jobs.

Using the table above, I put together a short slideshow to help visualize how the State-by-State targets will spread over time. For a full-screen view, click here:


Finally, check out Personal Kyoto for tips on what you can do to track your personal electricity usage.

Digg It! , Bookmark to del.icio.us , My Yahoo! , ATOM Feed

Monday, May 21, 2007

Danish-Style Energy Policy

About a month ago, the Wall Street Journal had an article on Denmark's approach to energy. The Danes are rock stars in the world of energy efficiency and conservation, their overall energy consumption is identical to what it was 30 years ago:

While America's energy consumption rose 40% over the same thirty-year period, the U.S. GDP quadrupled. Danish population went up 7% while US population went up 38% over the thirty-year period. U.S. population growth roughly tracked growth in energy consumption, while the Danes have gotten more energy efficient over the last thirty years (7% growth in population, zero growth in energy consumption). The kicker of course is the much faster growth in the U.S. economy.

Besides energy there are other forces at work to explain the much faster GDP growth in the U.S.: at 5.5M, Denmark's population is smaller than the SF Bay Area, and as a state with generous social welfare benefits, taxes are quite a bit higher than the U.S. Show an average American the above graph, they would likely say that for the given the growth in GDP, a 40% rise in energy consumption is acceptable. Denmark's economy has not grown as fast as the U.S., but they have had solid growth, and by European standards fairly low unemployment. With global warming increasingly becoming a problem, and with India and China poised to start consuming a lot more energy, the Danish approach has been attracting a lot of attention from policy makers worldwide.

Before we delve deeper into Danish energy policy, let's revisit a few head-to-head comparisons between the U.S. and Denmark. By some estimates Electricity and Heat generation account for about 40% of CO2 emissions in industrialized countries -- representing the largest source of emissions. The graphs below give a breakdown of Electricity and Heat generation for the U.S. and Denmark. Denmark is among the largest Wind Energy producers in the world, and in the graphs below Wind falls under "other" sources. For both Electricity and Heat generation, the combined shares of Biomass, Waste and Wind/Other in Denmark are impressive:


In terms of emissions per capita, Denmark is down 13% over the last 30 years, while the U.S. is producing 7% less emissions per capita over the same time period:


Now we turn to some hallmarks of Danish Energy policy as discussed in the WSJ article.

"But in Denmark, much of the country's energy sector is in the hands of nonprofit cooperatives, with residents as shareholders, which makes it easier for government to direct policy with little opposition from business interests."

Municipalities in California are starting to consider public power as a solution to their energy woes. The combination of rising electricity prices, the state's power crisis from a few years ago, and lower prices in LA, Palo Alto, Sacramento, Santa Clara and other localities with municipal power, have made public power a possibility in other parts of the state. Maybe what social scientists refer to as the external locus of control, is waning!

"'We redesigned the whole manufacturing process to save energy,' says Søren Eriksen, technical director of Danish Crown, a meat company that produces $11 billion of pork and beef annually. 'Everything is reused.' ... Danish companies pay 43% more per megawatt hour of electricity than companies in the U.S., 24% more than in France and 19% more than in England, according to Dansk Industri, an industry trade association."

In recent posts I highlighted the ineffcient use of energy in the U.S. Chemical industry, and energy arguments in favor of Organic agriculture. In Denmark, the high-cost of energy means that industries have no choice but be as energy efficient as possible:


The downside is that the high cost of energy (and labor costs) has made Denmark less-competitive in energy-intensive industries. U.S. industries seem to be trying to get ahead of climate change legislation and the ones who have the foresight will come up with cost-effective, innovative and game-changing technologies that promote energy-efficiency.

"A Dane buying a new car must pay a registration fee of approximately 105% of the car's value, plus additional taxes on fuel. ... Taxes now make up more than half of Danish households' electricity bills; prices at the gas pump doubled once fuel taxes took effect."

The car tax is a non-starter in the U.S.: Americans love their cars and mass transport sucks in most parts of the country. Any politician who even suggests a tax increase of that scale will be vilified. In a related article, the Journal featured Copenhagen and Amsterdam as bicycle nirvanas, places where more than a third of commuters go to work by bike. Copenhagen is launching more initiatives aimed specifically at encouraging even more bikers. Heck the Dutch PM sometimes bikes to work! A quick glance at a list of bike-friendly cities in the U.S. reveals mostly college towns, with a few large cities further down the list. I have to admit being impressed by the fact that Mayor Daley of Chicago bikes to work -- probably not in the winter :-)

"To build on the success of the new heating system, the government introduced a new building code in 1979 that forced people to build their homes with thicker insulation and tighter-sealing windows that would preserve energy. The building code is tightened periodically. It lowered Denmark's heating bill by 20% between 1975 and 2001, even though some 30% more heated floor space in buildings and homes was built during that period, according to the Danish Energy Authority."

Coincidentally, the NYTimes Magazine has an excellent article on this topic. By tightening building codes over the last decade, Green Building and Architecture has become a reality in parts of Western Europe. While U.S. politicians have been talking about ethanol, climate change, and more efficient cars, Green Architecture is an area which is ripe for discussion. In a future post, I will analyze energy use in the construction sector.

While parts of the Danish approach are non-starters in the U.S., its still interesting to see how this relatively small European country has chosen to address its energy challenges. More importantly, Denmark's energy policy has drawn a lot of interest from other countries. From an American perspective, all is not lost. As I pointed out in a previous post, sound energy policy already exists in the U.S.
Consider the case of California:


Power use per person has remained roughly stable in the state since the 1970s, even as it has doubled in the rest of the country (see chart above). As a result, California's greenhouse-gas emissions per person are on a par with those of Denmark. Relative to the size of its economy, they are lower.
Digg It! , Bookmark to del.icio.us , My Yahoo! , ATOM Feed

Tuesday, February 20, 2007

Wind Energy and the East Coast

Among U.S. states, California and Texas currently generate the most wind energy. It is also well-known that the Dakotas have enormous wind potential. I was pleasantly surprised to come across a recent paper highlighting wind energy available off the Northeastern seaboard. The study covers states (MA to NC, plus D.C.) adjacent to the Middle-Atlantic Bight (MAB):


(To enlarge a particular image, click on it.) The paper concludes that if one takes the total electricity and fuels consumed by the states, the total energy translates to just 64% of the wind energy available in the MAB. The 330 GW estimate is based on installing "... 166,720 wind turbines, each generating up to 5 megawatts of power." As we explain below, for added efficiency, the authors assumed the wind turbines were about half a mile apart.


Light vehicle fuels (gasoline) and, low-grade heat and building fuels (distillate fuel oil and natural gas), currently come from fossil fuels. The goal is to generate clean wind energy and move users to technologies that can harvest the energy through the power grid. Light vehicle fleet would be replaced by plug-in hybrids, heaters get replaced with electric space heaters, stoves with electric stoves, etc. Simply supplying more of the electricity and heating needs of these states, with wind would be a huge achievement. As I pointed out last week, 50% of electricity in the U.S. comes from coal. The authors estimate that replacing current energy sources with wind, would reduce CO2 emissions by 68%.

The paper also presents ideas on how to better match the supply of wind energy with "24 x 7" demand. A common criticism of wind energy is that it is unpredictable and not available when demand is highest. The authors point out that wind cross-correlations drops with distance: as the distance between two locations increase, the likelihood that wind occurs simultaneously at both sites, decreases. One way to increase wind availability, is to increase the number of sites, and connect them by electric transmission lines. Using models first presented in a previous paper, the authors demonstrate the power of "site diversification" on the availability of wind power. In the graph below, we present the amount of power generated by 1, 3, and 6 MAB wind sites. For convenience we normalized the hourly power outputs, of the 1, 3, or 6 sites, into a single 3.6 megawatt turbine:


The above graph is my attempt to replicate the original graph in the paper. A point on the horizontal axis represents the percentage of time (as measured by hours in a year) that wind power production is AT LEAST the value found on the vertical axis. The area under a curve, represents the amount of MWH produced in a year, by the given configuration of sites.

Using the curve for 1 Site, we note that 15% of the time no power is produced, and 13% of the time the site is generating the maximum amount of power. In the case of 6 sites (respectively 3 sites) power is off only 0.2% (respectively 3%) of the hours in a year. As the authors point out:
... Because wind speed cross-correlation drops with distance, distributed wind resources, connected by electrical transmission lines, produce more level power than their individual constituent sites. ... Since the off-time for all multi-site combinations is well under the 6% forced outage time for baseload fossil generators [North American Electric Reliability Council, 2005], it is incorrect to call power from these interconnected offshore wind sites ‘‘intermittent.’’ Rather, the problem is that the fluctuations in the wind resource are not matched to fluctuations in load, whereas fossil plants are scheduled to match load.
Distributed wind resources, connected by electric transmission lines, have off-times less than the 6% that fossil fuel generators typically have. To match wind power properly with fluctuations in demand, the authors give the following example:
... A light vehicle fleet of battery, plug-in hybrid and/or hydrogen fuel cell vehicles would have substantial energy storage, which could be controlled by the electric grid operator when the vehicle is idle and plugged-in. Assume 2/3 of the 29M registered automobiles in the MAB region [ U.S. Census Bureau, 2006] were electrified with 30 kWh storage, and assume that at any one time when needed, only half of these electrified vehicles could respond, each providing half their storage. This is a 145 GWh storage resource, capable of carrying the average 73 GW electrical load for 2 hours. Prior analysis of one such large-scale example showed that electrified vehicles would be sufficient for wind backup all but 5 times/year. For the occasions when vehicle storage is inadequate, today’s fossil fuel plants could be retained in standby mode and tapped several times per year. The inverse problem, excess wind power, would first supply any deferred demand for heat and vehicle battery charging; any subsequent remaining excess wind power would be sold on regional markets, or spilled.
In the absence of adequate storage, wind energy can still be used to lessen the use of fossil fuels. While the authors are not claiming that wind alone can displace all the fossil fuels used in the given states, clearly, the MAB region can supply enough wind to substantially reduce the amount of fossil fuels currently used. Given that progress and innovation will most likely accelerate over the next several years, solid state storage technologies are bound to improve and load matching will become more realistic.

Hopefully, the current crop of Presidential candidates will take the results of this research on the Middle-Atlantic Bight and use it to educate the American public about the enormous potential energy source sitting right off the East Coast. All it takes is one of the top-tier candidates to champion it!

Digg It! , Bookmark to del.icio.us , My Yahoo! , ATOM Feed

Monday, February 12, 2007

Coal and Electric Power Generation

In an earlier post, I noted that Electric Power Generation was the largest source of CO2 emissions: in the U.S. it accounts for about 40% and worldwide about 38%. This week I'll review the main sources of electric power, some technologies being developed to clean up power generation, and the political challenges that lie ahead. As in previous weeks, I'll argue that while technological developments are vital, the U.S. needs to show leadership in the area of conservation. While the developed world may be slowly waking up to the threat posed by climate change, we need to lead by example and demonstrate to the emerging economies of India and China, that conservation need not translate to slower economic growth.

Electric Power Generation
How does the U.S. generate electricity? Unfortunately, half of the total electric power generated still comes from coal:

(To enlarge a particular image, click on it.) Renewables accounted for a mere 2%! But at least Renewables have grown the fastest, right? Actually, Natural Gas is the fastest growing source of Electricity, while the growth in Renewables was just on par with the growth in Nuclear and Coal:

Does the importance of Coal in the Electric Utility sector explain why the U.S. has not signed on to the Kyoto Protocol? The OECD countries (Europe + North America + Japan + Korea + Austalia +NZ) collectively, rely less on Coal:

Meanwhile, the two most populous countries and their surging economies, are even more heavily dependent on Coal:

Close to 80% of all electricity in China is generated from Coal! But with China (and India) one always needs to factor in their pace of growth. Warning, the statistics cited below are mind-blowing:
China’s soaring economic growth has been headlined in recent years by a single, attention-grabbing statistic: China each year adds new power generating capacity equal to the UK’s entire electricity grid. But China surpassed this benchmark last year, according to new figures released quietly at the end of January by the China Electric Power News, the mouthpiece of the state industry. The paper reported that new power capacity in 2006 had expanded by 102 gigawatts, or roughly equal to the entire capacity of the UK and Thailand combined, or about twice the generating assets of California, the state with the biggest economy in the US.
... Just less than 90 per cent of the new plants are powered by coal, an inevitable result of a rapid build-up in capacity. Hydro power accounted for 10 per cent and new nuclear plants about 1 per cent.
Even if the share of Coal drops to 50% in both China and India, which would be remarkable given their current dependence on coal, their growth rates translates to a lot more Coal powered utility plants over the next decade.

Based on the numbers above, Coal will be a major source of electricity for years to come. More environmentalists are realizing that eliminating coal completely is a difficult proposition:
Like it or not, a future without coal is politically implausible in the near term, says David Hawkins, director of the climate program at the Natural Resources Defense Council: "While as a technical matter we could run the world's economy without coal, as a political matter it is not going to happen fast enough. The fuel's abundance and low cost make it something that most political leaders are unwilling to give up. We must do everything we can to accelerate our use of renewables, but the renewable-energy future is far too slow in coming to put all our eggs in that basket," Hawkins argues. "We have to start reducing greenhouse gases before we phase out fossil fuels."
The problem at least appears manageable: install technology at the Electric Utilities to reduce or eliminate emissions. While one need only deal with a fixed number of locations, it still requires technologies that are expensive to develop and deploy. The U.S. will most likely be at the forefront of "Clean Coal" technologies. America is the "Saudi Arabia of Coal", with 27% of all known coal reserves, and Business Leaders in the U.S. are starting to see the business potential of "Clean Coal".

Clean Coal and Carbon Sequestration
What exactly is "Clean Coal"? To address that question, we need to understand some basic facts about coal. Besides generating CO2 emissions:
... coal is as filthy as it is cheap and abundant. When burned it releases three pounds of sulfur dioxide and four pounds of nitrogen oxide for every megawatt-hour of operation. The nation's plants produce a total of about 48 tons of mercury annually.
One promising form of Clean Coal is:
... integrated gasification combined cycle—a mouthful usually shortened to IGCC. Unlike conventional coal-fired generators, IGCC plants don't actually burn the coal itself; they convert it into gas and burn the gas. This highly efficient process makes it possible to selectively pull out the resulting emissions, including carbon dioxide, which could then be collected and buried rather than released into the air.
... IGCC technology also gives engineers unprecedented control over what happens to the different components of coal after they go into the power plant. In normal coal-fired plants, nearly all the pollutants go up the smokestack, where some of them are captured from the exhaust by scrubbers. Here they never even hit the flame. Conventional plants burn pulverized coal in the air, which contains about 78 percent nitrogen. Since the burning takes place at low pressure, the carbon dioxide is diffuse; isolating it is difficult and expensive. Burning gasified coal in pure oxygen at high pressure concentrates the carbon dioxide, making it far easier to capture.
What happens to the CO2 emissions? Technologies which address this problem fall under the emerging field of Carbon Sequestration:
... In September 2005, the Intergovernmental Panel on Climate Change, a United Nations organization that includes scientists from nearly every country in the world, released a report estimating that 2 trillion tons of carbon dioxide could be stored in old coal mines, abandoned oil and gas fields, and in various other geologic formations around the world. That's a huge reservoir, even compared to the rate at which humans are now burning fossil fuels. "The estimated storage capacity equals about 80 times the total rate at which we make carbon dioxide from everything per year," Robert Socolow, a Princeton University physicist who coheads its Carbon Mitigation Initiative. Coal-power plants account for about 25 percent of that carbon dioxide, so it's 320 years of coal-power emissions."
Three large-scale carbon storage, or sequestration, projects are testing ways to bury carbon dioxide effectively. The world's oldest carbon-sequestration experiment began in the North Sea oil fields in 1996. Statoil, the Norwegian national oil company, extracts carbon dioxide from natural gas and pumps 2,800 tons of it every day 3,000 feet below the North Sea floor, trapping it in sandstone. A 250-foot-thick layer of shale covers the entire sandstone formation, and it seems to be leakproof. Statoil estimates that all the carbon dioxide emissions from every power plant in Europe for the next 600 years could be stored in the formation.
Of course these promising technologies will translate to added costs to the Utility companies. Consumers, Politicians and Business leaders need to put pressure on the Utilities to start investing in these technologies. This is an issue that requires more legislative and media attention. Unfortunately, Clean Coal has nowhere near the amount of media coverage as Corn Ethanol.

Don't Forget About Conservation
I have consistently argued that Conservation is something we in the U.S. must do more of. We need technologies to produce "clean" energy, AND technologies that drastically reduce the amount of energy we use. Ideally, we would combine technological advances with voluntary reduction in consumption. In a previous post, I highlighted the states that consumed the least amount of electricity per capita:

Besides being blessed with great weather, California is also the one state were bipartisan consensus has led to longstanding conservation programs.

Coal Industry Awakens
Exploiting calls for "energy independence", the coal lobby is pushing coal as another domestic fuel source. A recent article in the Wall St. Journal (subscription required) touched on the critical need to consider global climate change as part of any energy solution:
... Greater use of liquid fuels made from coal, the nation's most plentiful energy source, would reduce reliance on imported oil. But making the liquid fuels and burning them in automobile engines would release additional carbon dioxide, a greenhouse gas thought to accelerate climate change, environmentalists say.
... David Hawkins, a climate-change expert for the Natural Resources Defense Council, says the diesel fuel still contains carbon dioxide, which will be released into the air when it is burned in the engines of cars and trucks. "This issue is the classic example of why you need to have an integrated policy on both global warming and energy," he says.
Finally, to understand the importance of coal in the 2008 Presidential Elections, we note that the swing state of Ohio, and Iowa (the home of the first primaries) have a lot of coal reserves:


Digg It! , Bookmark to del.icio.us , My Yahoo! , ATOM Feed

Monday, February 05, 2007

Ethanol in the U.S.

In last week's post, I noted that the two main sources of C02 emissions are Transportation and Electric Power Generation. Worldwide, Transportation accounted for about 20% of total CO2 emissions, and in the US it accounts for about 33%.

Concern about climate change and the rise in oil prices over the last 5 years partially explains the Ethanol craze that has gripped policy-makers and the private sector. Last month's State of the Union address was the second year in a row that Ethanol was the centerpiece of the President's "energy security" policy. In the U.S., the politics of ethanol is closely connected to corn subsidies. Unfortunately for all the talk about "energy independence", not enough advocacy is spent on climate change and conservation. In this post I'll try to give a brief overview of ethanol fuel in the U.S.

To start, we note that as the price of oil has gone down, ethanol futures prices have declined (graph from the WSJ, subscription required):

(To enlarge a particular image, click on it.) Conventional thinking asserts that in order for ethanol to take off among consumers, oil prices need to stay relatively high. On top of having to rely on high oil prices, ethanol fuel still relies on a slew of goverment subsidies. With optimism in the industry at an all-time high, but with serious challenges still in place, there is growing concern that the Ethanol sector is suffering from over-investment:
... These analysts see an analogy in the dot-com bust of 2000. The bust cleared out some of the worst ideas and least-efficient companies in the tech arena, allowing deeper-pocketed investors to consolidate operations and emerge leaner to make the Internet an even more powerful force in the world economy. ... "People will overextend and many plants will have financial difficulty," says Ricardo Leiman, Noble's chief operating officer. But he adds that as facilities fail, that could create more opportunities for bigger investors to move in. Of course, all bets are off if oil prices keep falling. If that happens, alternative energies could wither just as they did after the retreat of the oil-price surges of the 1970s.
Ethanol production, in the U.S. has been on a consistent upward trend, and since 2000 it has really taken off. The year 2000 was when the EPA recommended that the fuel additive, MTBE, be phased out nationally:

Brazil is the leading producer of fuel ethanol in the world, with 2nd place U.S. rapidly closing the gap. In the above graph, the U.S. data spans 1980-2005, while our data for Brazil spans 1982-2005. After Brazil and the U.S., 3rd place China produced about a quarter of what Brazil and the U.S. did in 2005. At a time when some analysts have pointed out that demand has yet to fully catch up with domestic production, imports are also steadily rising (WSJ, subscription required):

With fuel ethanol production steadily rising, U.S. corn production is increasingly being diverted to ethanol:

As of 2006, 20% of corn production is used for ethanol: roughly equal to the amount of corn being exported overseas. The upward trend in the amount of corn used for fuel ethanol is unmistakable. In Brazil, estimates place the amount of sugar being used for ethanol at around 50-60%. Biofuel production is starting to affect commodity prices.

The main difference between Brazilian and U.S. ethanol lies in the feedstock used:

In the U.S. corn-based ethanol accounts for about 95% of total production, while Brazil relies almost entirely on sugar/sugarcane. The choice of feedstock determines the net energy produced:

The above graph, produced by researchers in Brazil, estimates that ethanol made from sugarcane yields at least 8 times the amount of energy used to produce it, while corn ethanol only yields about 1.6 times. Some prominent researchers have published papers suggesting that corn-based ethanol actually "... requires 29 percent more fossil energy than the fuel produced". Recently, a team from UC Berkeley reviewed six representative studies, and concluded that:
Studies that reported negative net energy incorrectly ignored coproducts and used some obsolete data. All studies indicated that current corn ethanol technologies are much less petroleum-intensive than gasoline but have greenhouse gas emissions similar to those of gasoline. (from the Journal Science, January 2006)
What the Berkeley team found after reviewing data from several research studies was while corn ethanol had a slightly positive energy output, in terms of greenhouse gas emissions it is not much of an improvement over gasoline. Their best estimates suggest that Corn Ethanol leads to a mere 18% reduction in emissions, unless current production methods become cleaner. For Cellulosic Ethanol, their calculations change drastically: they found that switching from gasoline to Cellulosic Ethanol led to a 90% reduction in greenhouse gas emissions. The US Department of Energy estimates that Cellulosic Ethanol yields about 2.6 times the amount of energy used to produce it. In a future post, I will discuss another promising alternative: bio-diesel.

Based on energy yield and reduction in greenhouse emissions, Cellulosic or Sugarcane Ethanol are clearly more desirable than Corn. Sugarcane ethanol imports from Brazil are rising, and local producers of corn ethanol are actively lobbying for the continuation of import tariffs. Cellulosic ethanol is not yet being produced on a commercial scale. Although there is growing excitement about the prospects of Cellulosic Ethanol, ethanol in the U.S. will, at least over the next several years, be primarily derived from Corn. Corn Ethanol has a lot of boosters:

Corn subsidies are a staple of American politics. In 2005, $9.4B in subsidies went to geographic areas that also happen to be important "battleground" states:

Iowa (earliest presidential primary), Illinois (home of Barack Obama), and the swing states of MN, OH, WI, MO, MI received substantial percentages of the 2005 corn subsidies. It is safe to assume that Corn ethanol will be heavily promoted over the next few years. In fact, the Corn lobby is already starting to push back against imported Sugarcane ethanol:
... With all that guaranteed demand, more than makers of corn-based ethanol could ever meet, one might think there was no longer any need for the 51-cent-a-gallon tax credit for ethanol, which will cost taxpayers about $2.6 billion next year and more in later years as ethanol production rises. One might also think that, since the goal is to "diversify" the U.S.'s energy sources, there is little reason to continue a 54-cent-a-gallon tariff on imports of sugar-derived ethanol from Brazil.

... The reason has little to do with economics, and a lot to do with the politics of corn. The tax credit was born during the oil-price spike of 1978; the tariff was added to prevent foreign producers from getting U.S. subsidies. The two measures sustained an embryonic ethanol industry in corn-growing states when oil prices were low and there wasn't much government, consumer or Wall Street interest in alternative fuels.

Times have changed, but the folks who benefit don't much like the idea of repealing the credit or tariff. And they have a lot of friends in the Senate -- including Charles Grassley of Iowa, the top Republican on the Senate Finance Committee -- and among presidential candidates, for whom ticking off Iowa's corn farmers would be an exercise in masochism.
Finally, conservation should be an important component of any energy policy. While fuel efficiency is frequently mentioned, over-consumption is hardly ever raised. In an economy heavily dependent on consumer spending, we may have to start using less fuel:
... not only are there more people in the U.S., but each one of them burns through much, much more oil. Americans burn through 27 barrels of oil annually per capita, six times and change more than the Brazilians' 4.2 barrels. The U.S. produces more oil per capita, too -- 11 barrels to Brazil's 3.35 barrels. And the gap between production and consumption in the U.S. is a gaping 16 barrels per person per year, while Brazil's gap amounts to just 0.85 barrels.
In 2004, the U.S. consumed 44% of total gasoline worldwide! If California were a separate country, it would have ranked 2nd in terms of total consumption:

In a previous post, I noted that California is actually among the states which use the LEAST amount of gasoline, on a per capita basis. China and India are large countries whose consumers are starting to embrace the automobile. The recent UN report on climate change linked human activity to gloabl warming, fortunately, it comes at a time when the two most populous countries are starting to fall in love with motor vehicles. To show some leadership on this issue, the U.S. needs to reduce its net gasoline consumption. But conservation is not something that either the Democrats or Republicans are willing to talk about. The outlook is especially bleak over the next two years. In comparison, Corn ethanol has no shortage of advocates. Paul Krugman observes:
... Subsidizing ethanol benefits two well-organized groups: corn growers and ethanol producers (especially the corporate giant Archer Daniels Midland). As a result, it's bad policy with bipartisan support. For example, earlier this month legislation calling for a huge increase in ethanol use was introduced by five senators, of whom four, including presidential aspirants Barack Obama and Joseph Biden, were Democrats. In a recent town meeting in Iowa, Hillary Clinton managed to mention ethanol twice, according to The Politico. Meanwhile, conservation doesn't have anything like the same natural political mojo. Where's the organized, powerful constituency for tougher fuel economy standards, a higher gasoline tax, or a cap-and-trade system on carbon dioxide emissions? Can anything be done to promote good energy policy? Public education is a necessary first step, which is why Al Gore deserves all the praise he's getting.
UPDATE (3/19/2007): Business Week chronicles the growing opposition to corn-based ethanol.

UPDATE (3/26/2007): The Washington Post has an article and an online chat on problems with corn-based ethanol.

Digg It! , Bookmark to del.icio.us

Monday, January 22, 2007

U.S. Renewable Energy Consumption

I recently came across data sets on Renewable Energy Consumption from the U.S. Census. Besides recent Consumption rates, we will examine historical rates and trends. Consumption gives a good proxy for the growth in investments in particular types of renewables: the more projects get funded, the more energy is available for consumption.

The U.S. Census defines renewable energy as:
... obtained from sources that are essentially inexhaustible unlike fossil fuels of which there is a finite supply.
Using this definition, the U.S. Census included the following sources:
  • Biomass: Organic nonfossil material of biological origin constituting a renewable energy source.
  • (Conventional) Hydroelectric: Power produced from natural streamflow as regulated by available storage.
  • Geothermal: As used at electric power plants, hot water or steam extracted from geothermal reservoirs in the Earth's crust that is supplied to steam turbines at electric power plants that drive generators to produce electricity.
  • Wind: Energy present in wind motion that can be converted to mechanical energy for driving pumps, mills, and electric power generators. Wind pushes against sails, vanes, or blades radiating from a central rotating shaft.
  • Solar: Includes small amounts of distributed solar thermal and photovoltaic energy.
We quickly plot the total consumption (in Quadrillion BTU's) over the 2003-2004 period. (To enlarge a particular image, click on it.)


A drawback in the U.S. Census data set is that it ends in 2004: there has been a surge in interest in renewables, over the last 2 years, among the general public, policy makers, and the private sector. Rising oil prices, articles about "peak oil", instability in oil producing regions, and increasing concern about climate change have all contributed to the overall interest in renewables. I'm particularly interested in Wind and Solar, which the graph shows are small relative to the other sources. How fast have consumption in Solar and Wind grown in the last decade? Recent media coverage in Wind and Solar energy included pending/current projects, interesting start-ups, and increased interest from VC's. Based on the volume of media reports, one gets the sense that Wind and Solar projects and companies have gone mainstream.

The bar graph gives us an idea of the total 2003-2004 consumption in the different sources of renewable energy. What about growth rates and recent trends? The problem with using regular time-series graphs is that the difference in magnitudes (Biomass is much larger than Solar) will hide trends for the smaller energy sources (Geothermal, Wind, Solar). A common trick is to normalize all the time-series, so they start at a common value (say 100), then use their respective year-over-year growth rates to plot the rest of the graph:


Using the normalized values, we expect the smaller sources to display faster growth rates. Nonetheless, Wind Energy consumption has skyrocketed since 1998. The American Wind Energy Association has an "installed capacity" graph which shows a similar post-1998 growth spurt. What happened in the Wind Energy sector during the late 1990s? A combination of contract negotiations with Utilities, new turbine technology, and geographic diversification:
In the 1990s, the California wind farm market began to be affected by the expiration or forced re-negotiation of attractive power purchase contracts with the major California utilities: Southern California Edison and Pacific Gas and Electric. And much of the existing inventory of 1980's wind turbines were really an albatross around the wind industry's neck. Renewal was needed, and -- bouyed by "green power" initiatives in Colorado, Texas and elsewhere -- U.S. wind energy development resumed in 1999, with a much broader geographical base.
Since the growth in Wind Energy distorted the graph, here is a view minus Wind Energy:


I was suprised by the slow growth in Solar Energy consumption. From 1989 to 2004, Solar Energy consumption grew a paltry 15%, compared to a 550% increase in Wind Energy consumption. Based on tax incentives made available over the last two years, I am inclined to believe that Solar Energy consumption grew rapidly in 2005-2006. I look forward to updating these charts to include years after 2004.

So which states are the leading producers of renewable energy? In an earlier post, I listed the top ethanol producing states. The American Wind Energy Association has a nice map showing Texas and California as the top 2 states in terms of megawatts derived from Wind Energy. I hope to address this question in more detail in future posts. For now, here is renewable energy production, as compiled by the U.S. Census:


Given that production was measured in millions of kilowatt hours, I wonder if this data came from utility companies. Note that the aggregation by type, looks quite different from the earlier consumption bar chart.

Monday, December 11, 2006

Electricity, Gasoline, and Ethanol By State

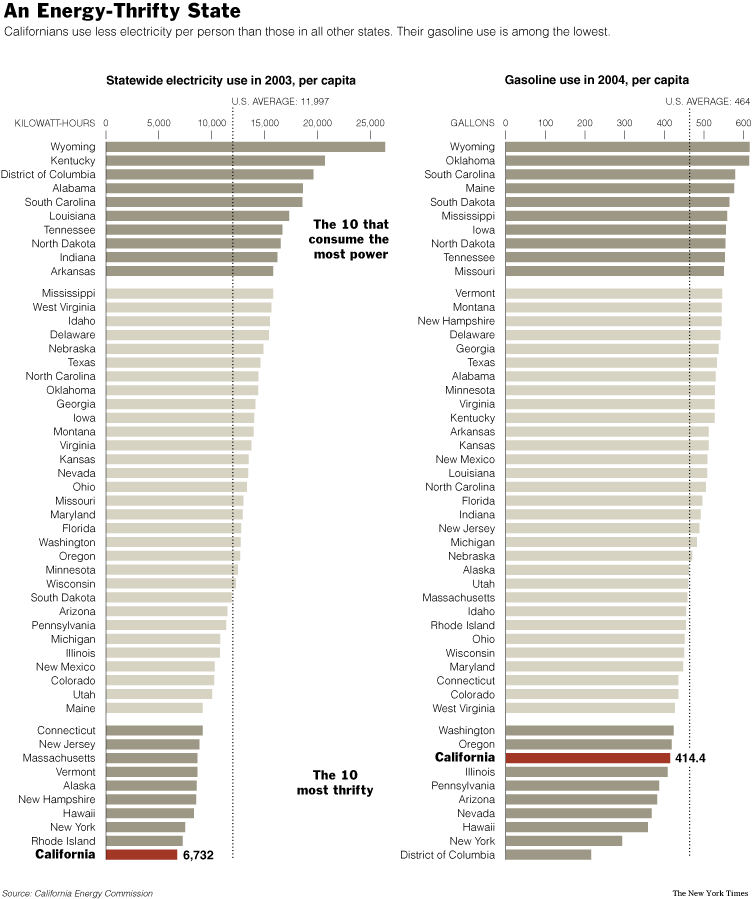
A recent NY Times article had an interesting graphic detailing the per capita consumption of electricity and gasoline. (To enlarge a particular image, click on it.)


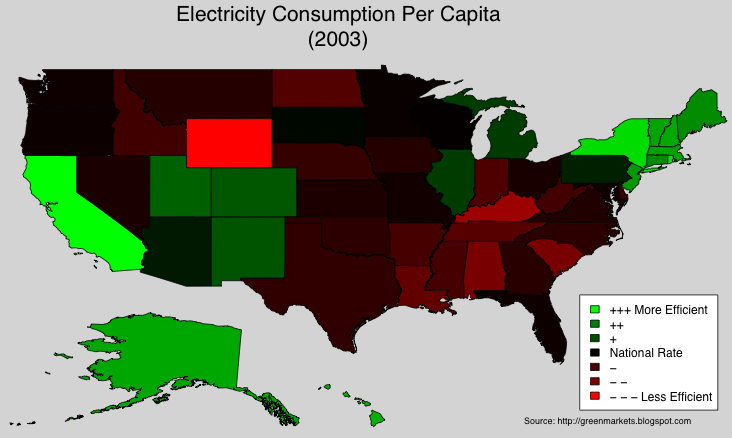
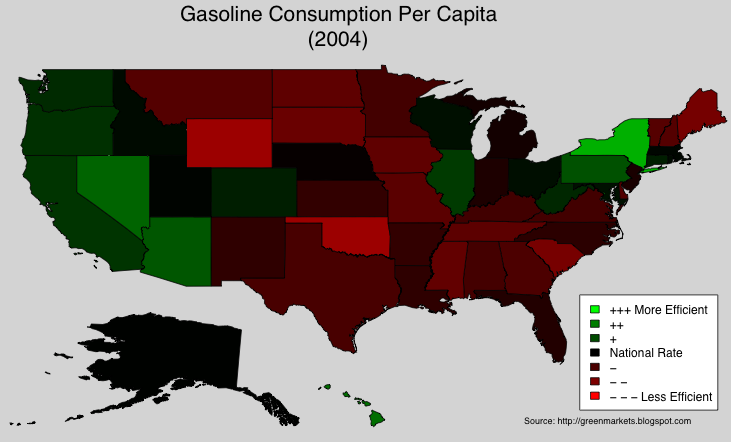
Wanting a different visual for these consumption rates, I took the data and generated corresponding heat maps. In the next two maps, Green signifies a state consumes less (per capita) compared to the U.S. Per Capita Rate, Red signifies the state consumes more per capita than the nation, Black means the state consumes about the same amount of energy per capita as the entire nation.

In terms of per capita electricity consumption, CA is the most efficient. Is this partly due to the adjustments the state made in response to the 2000-2001 energy crisis?


The answer is, mostly no: the NY Times also featured a graphic which showed that California's per capita electricity consumption has more or less been flat since the late 1970s. While the development of renewables is crucial, efficiency and conservation are just as important. The market for "green" energy solutions includes efficient appliances and other technologies which help people consume less energy. The map above highlights vast untapped markets for such solutions.

The gasoline consumption data shows that the West and the Northeast, are once again, more efficient than the National Average:


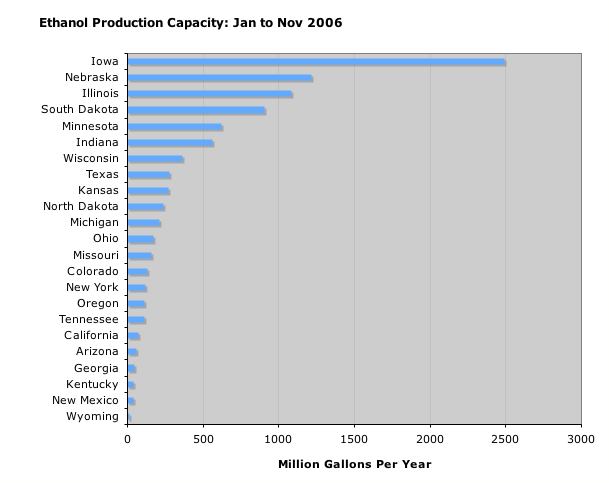
High gasoline usage is probably due to the use of farm equipment and trucks. As we next show, some of the gas guzzling states are the leading producers of (corn based) ethanol.

According to the DOE, current average energy yield for corn based ethanol is 25% ("... 25 percent more energy than is used in growing the corn, harvesting it, and distilling it into ethanol"). Most of the ethanol produced in the U.S. is from corn, so it is no suprise that the Midwest dominates:


As cellulosic ethanol becomes more common, I expect the rest of the country to ramp up their production.

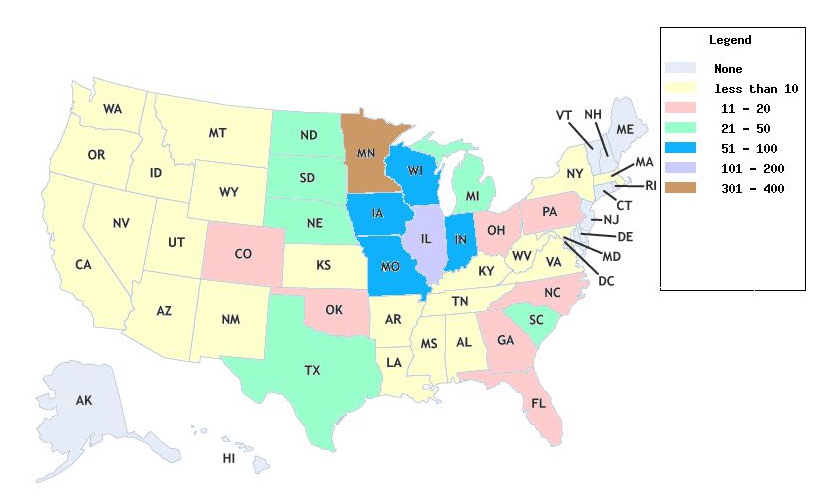
The Energy Policy Act of 1992 considers E85 (85% ethanol, 15% gasoline) and blends with even higher concentration of ethanol to be "alternative" fuels. Which states use the most E85 gas? A proxy for consumption of E85 is the number of E85 fueling stations available from the DOE (if you can't pump it, you can't use it):


The earlier map showing gasoline consumption per capita gives a list of "green" states where E85 stations would be popular. A gas station owner in these states, can count on positive publicity and a steady stream of customers. As of early December 2006, California has FOUR E85 stations: two of which are in the Lawrence Berkeley Labs!