Showing posts with label climate change. Show all posts

Monday, March 05, 2007

Renewables and Big Oil

With oil prices still at historic levels, expect 2007 to be another banner year for the major oil companies. Exxon-Mobil alone took in over $3.2B per month (or over $108M per day) in profits in 2006! With such large profits available in the fossil fuel business, are any of the majors seriously investing in renewables? They are, but the amount varies across companies. The majors see themselves as not holding any competitive advantage over others when it comes to renewables, and most of their shareholders prefer they concentrate on their core businesses.

We first look at the size of their 2006 profits, relative to their market capitalization:


(To enlarge a particular image, click on it.) One thing that jumps out is how large (in terms of market cap) Exxon-Mobil is compared to the other companies. While the French company Total S.A. underperformed (profit was low for its market cap), it still took in a healthy $16.4B in profits. In fact, except for Total S.A., all the other companies have p/e ratios much lower than the S&P 500.

How much of these profits do they invest in renewables? I found estimates for Exxon-Mobil & Royal Dutch Shell, and for BP and Chevron. While I found references to investments made by PetroChina and Total S.A., I was unable to find estimates for their annual spending.


Compared to their peers, BP and Chevron are investing a decent portion of their profits into renewable energy, while Exxon-Mobil is essentially not investing anything in renewables. Exxon-Mobil's strategy is to invest minimally, but be ready to jump in when the market for renewables mature -- their lack of investment in renewables, has definitely not hurt their stock price! Some environmentalists have accused oil companies, in particular BP, of greenwashing. While BP is likely doing some amount of greenwashing, IMHO, one has to compare BP to its peers to put their efforts in the proper context. Not that this criteria is sufficient, but clearly BP has gotten the message more that its competitors: in 2006, the size of Exxon-Mobil's investment in renewables was less than the retirement package of their outgoing CEO.

Here is another view of the size of investments using a bubble chart. In the graph below, the size of a "bubble" indicates the "relative" size of investments in renewables (i.e. relative to its peers).


The next-generation, disruptive, energy technologies will not come from oil companies enjoying record level profits. Progress will depend on more funding from the Federal Goverment. R&D funding needs to be accompanied, at least for the next few years, with incentives for consumers and manufacturers. As an example of the need for incentives, the U.S. has been the leader in solar energy research for years, yet the largest market for panels are Germany and Japan. Germany and Japan nurtured their markets for solar cells through incentives. Only recently have states and the federal goverment started to offer rebates and tax breaks to encourage adoption of solar technology.

While the states and the federal goverment funds basic R&D and incentives, innovation and the next generation energy companies will need to comes from private sector. Fortunately, segments of the private sector in the U.S. have recognized the huge market for renewables. Increasingly engineers and venture capitalists in Silicon Valley have been focusing on renewable energy. A recent panel discussion on Clean Technology during the State of the Valley conference, is an interesting introduction to how some people in the Valley are tackling the energy problem.

In a future post, I will discuss the importance of energy efficiency and conservation. Interestingly, one of the leading research groups in end-use efficiency happens to be located in the SF Bay area.

UPDATE: The SF Chronicle has an article on critics of a proposed, UC Berkeley based, Energy Biosciences Institute funded by BP.

Digg It! , Bookmark to del.icio.us , My Yahoo! , ATOM Feed

Tuesday, February 20, 2007

Wind Energy and the East Coast

Among U.S. states, California and Texas currently generate the most wind energy. It is also well-known that the Dakotas have enormous wind potential. I was pleasantly surprised to come across a recent paper highlighting wind energy available off the Northeastern seaboard. The study covers states (MA to NC, plus D.C.) adjacent to the Middle-Atlantic Bight (MAB):


(To enlarge a particular image, click on it.) The paper concludes that if one takes the total electricity and fuels consumed by the states, the total energy translates to just 64% of the wind energy available in the MAB. The 330 GW estimate is based on installing "... 166,720 wind turbines, each generating up to 5 megawatts of power." As we explain below, for added efficiency, the authors assumed the wind turbines were about half a mile apart.


Light vehicle fuels (gasoline) and, low-grade heat and building fuels (distillate fuel oil and natural gas), currently come from fossil fuels. The goal is to generate clean wind energy and move users to technologies that can harvest the energy through the power grid. Light vehicle fleet would be replaced by plug-in hybrids, heaters get replaced with electric space heaters, stoves with electric stoves, etc. Simply supplying more of the electricity and heating needs of these states, with wind would be a huge achievement. As I pointed out last week, 50% of electricity in the U.S. comes from coal. The authors estimate that replacing current energy sources with wind, would reduce CO2 emissions by 68%.

The paper also presents ideas on how to better match the supply of wind energy with "24 x 7" demand. A common criticism of wind energy is that it is unpredictable and not available when demand is highest. The authors point out that wind cross-correlations drops with distance: as the distance between two locations increase, the likelihood that wind occurs simultaneously at both sites, decreases. One way to increase wind availability, is to increase the number of sites, and connect them by electric transmission lines. Using models first presented in a previous paper, the authors demonstrate the power of "site diversification" on the availability of wind power. In the graph below, we present the amount of power generated by 1, 3, and 6 MAB wind sites. For convenience we normalized the hourly power outputs, of the 1, 3, or 6 sites, into a single 3.6 megawatt turbine:


The above graph is my attempt to replicate the original graph in the paper. A point on the horizontal axis represents the percentage of time (as measured by hours in a year) that wind power production is AT LEAST the value found on the vertical axis. The area under a curve, represents the amount of MWH produced in a year, by the given configuration of sites.

Using the curve for 1 Site, we note that 15% of the time no power is produced, and 13% of the time the site is generating the maximum amount of power. In the case of 6 sites (respectively 3 sites) power is off only 0.2% (respectively 3%) of the hours in a year. As the authors point out:
... Because wind speed cross-correlation drops with distance, distributed wind resources, connected by electrical transmission lines, produce more level power than their individual constituent sites. ... Since the off-time for all multi-site combinations is well under the 6% forced outage time for baseload fossil generators [North American Electric Reliability Council, 2005], it is incorrect to call power from these interconnected offshore wind sites ‘‘intermittent.’’ Rather, the problem is that the fluctuations in the wind resource are not matched to fluctuations in load, whereas fossil plants are scheduled to match load.
Distributed wind resources, connected by electric transmission lines, have off-times less than the 6% that fossil fuel generators typically have. To match wind power properly with fluctuations in demand, the authors give the following example:
... A light vehicle fleet of battery, plug-in hybrid and/or hydrogen fuel cell vehicles would have substantial energy storage, which could be controlled by the electric grid operator when the vehicle is idle and plugged-in. Assume 2/3 of the 29M registered automobiles in the MAB region [ U.S. Census Bureau, 2006] were electrified with 30 kWh storage, and assume that at any one time when needed, only half of these electrified vehicles could respond, each providing half their storage. This is a 145 GWh storage resource, capable of carrying the average 73 GW electrical load for 2 hours. Prior analysis of one such large-scale example showed that electrified vehicles would be sufficient for wind backup all but 5 times/year. For the occasions when vehicle storage is inadequate, today’s fossil fuel plants could be retained in standby mode and tapped several times per year. The inverse problem, excess wind power, would first supply any deferred demand for heat and vehicle battery charging; any subsequent remaining excess wind power would be sold on regional markets, or spilled.
In the absence of adequate storage, wind energy can still be used to lessen the use of fossil fuels. While the authors are not claiming that wind alone can displace all the fossil fuels used in the given states, clearly, the MAB region can supply enough wind to substantially reduce the amount of fossil fuels currently used. Given that progress and innovation will most likely accelerate over the next several years, solid state storage technologies are bound to improve and load matching will become more realistic.

Hopefully, the current crop of Presidential candidates will take the results of this research on the Middle-Atlantic Bight and use it to educate the American public about the enormous potential energy source sitting right off the East Coast. All it takes is one of the top-tier candidates to champion it!

Digg It! , Bookmark to del.icio.us , My Yahoo! , ATOM Feed

Monday, February 12, 2007

Coal and Electric Power Generation

In an earlier post, I noted that Electric Power Generation was the largest source of CO2 emissions: in the U.S. it accounts for about 40% and worldwide about 38%. This week I'll review the main sources of electric power, some technologies being developed to clean up power generation, and the political challenges that lie ahead. As in previous weeks, I'll argue that while technological developments are vital, the U.S. needs to show leadership in the area of conservation. While the developed world may be slowly waking up to the threat posed by climate change, we need to lead by example and demonstrate to the emerging economies of India and China, that conservation need not translate to slower economic growth.

Electric Power Generation
How does the U.S. generate electricity? Unfortunately, half of the total electric power generated still comes from coal:

(To enlarge a particular image, click on it.) Renewables accounted for a mere 2%! But at least Renewables have grown the fastest, right? Actually, Natural Gas is the fastest growing source of Electricity, while the growth in Renewables was just on par with the growth in Nuclear and Coal:

Does the importance of Coal in the Electric Utility sector explain why the U.S. has not signed on to the Kyoto Protocol? The OECD countries (Europe + North America + Japan + Korea + Austalia +NZ) collectively, rely less on Coal:

Meanwhile, the two most populous countries and their surging economies, are even more heavily dependent on Coal:

Close to 80% of all electricity in China is generated from Coal! But with China (and India) one always needs to factor in their pace of growth. Warning, the statistics cited below are mind-blowing:
China’s soaring economic growth has been headlined in recent years by a single, attention-grabbing statistic: China each year adds new power generating capacity equal to the UK’s entire electricity grid. But China surpassed this benchmark last year, according to new figures released quietly at the end of January by the China Electric Power News, the mouthpiece of the state industry. The paper reported that new power capacity in 2006 had expanded by 102 gigawatts, or roughly equal to the entire capacity of the UK and Thailand combined, or about twice the generating assets of California, the state with the biggest economy in the US.
... Just less than 90 per cent of the new plants are powered by coal, an inevitable result of a rapid build-up in capacity. Hydro power accounted for 10 per cent and new nuclear plants about 1 per cent.
Even if the share of Coal drops to 50% in both China and India, which would be remarkable given their current dependence on coal, their growth rates translates to a lot more Coal powered utility plants over the next decade.

Based on the numbers above, Coal will be a major source of electricity for years to come. More environmentalists are realizing that eliminating coal completely is a difficult proposition:
Like it or not, a future without coal is politically implausible in the near term, says David Hawkins, director of the climate program at the Natural Resources Defense Council: "While as a technical matter we could run the world's economy without coal, as a political matter it is not going to happen fast enough. The fuel's abundance and low cost make it something that most political leaders are unwilling to give up. We must do everything we can to accelerate our use of renewables, but the renewable-energy future is far too slow in coming to put all our eggs in that basket," Hawkins argues. "We have to start reducing greenhouse gases before we phase out fossil fuels."
The problem at least appears manageable: install technology at the Electric Utilities to reduce or eliminate emissions. While one need only deal with a fixed number of locations, it still requires technologies that are expensive to develop and deploy. The U.S. will most likely be at the forefront of "Clean Coal" technologies. America is the "Saudi Arabia of Coal", with 27% of all known coal reserves, and Business Leaders in the U.S. are starting to see the business potential of "Clean Coal".

Clean Coal and Carbon Sequestration
What exactly is "Clean Coal"? To address that question, we need to understand some basic facts about coal. Besides generating CO2 emissions:
... coal is as filthy as it is cheap and abundant. When burned it releases three pounds of sulfur dioxide and four pounds of nitrogen oxide for every megawatt-hour of operation. The nation's plants produce a total of about 48 tons of mercury annually.
One promising form of Clean Coal is:
... integrated gasification combined cycle—a mouthful usually shortened to IGCC. Unlike conventional coal-fired generators, IGCC plants don't actually burn the coal itself; they convert it into gas and burn the gas. This highly efficient process makes it possible to selectively pull out the resulting emissions, including carbon dioxide, which could then be collected and buried rather than released into the air.
... IGCC technology also gives engineers unprecedented control over what happens to the different components of coal after they go into the power plant. In normal coal-fired plants, nearly all the pollutants go up the smokestack, where some of them are captured from the exhaust by scrubbers. Here they never even hit the flame. Conventional plants burn pulverized coal in the air, which contains about 78 percent nitrogen. Since the burning takes place at low pressure, the carbon dioxide is diffuse; isolating it is difficult and expensive. Burning gasified coal in pure oxygen at high pressure concentrates the carbon dioxide, making it far easier to capture.
What happens to the CO2 emissions? Technologies which address this problem fall under the emerging field of Carbon Sequestration:
... In September 2005, the Intergovernmental Panel on Climate Change, a United Nations organization that includes scientists from nearly every country in the world, released a report estimating that 2 trillion tons of carbon dioxide could be stored in old coal mines, abandoned oil and gas fields, and in various other geologic formations around the world. That's a huge reservoir, even compared to the rate at which humans are now burning fossil fuels. "The estimated storage capacity equals about 80 times the total rate at which we make carbon dioxide from everything per year," Robert Socolow, a Princeton University physicist who coheads its Carbon Mitigation Initiative. Coal-power plants account for about 25 percent of that carbon dioxide, so it's 320 years of coal-power emissions."
Three large-scale carbon storage, or sequestration, projects are testing ways to bury carbon dioxide effectively. The world's oldest carbon-sequestration experiment began in the North Sea oil fields in 1996. Statoil, the Norwegian national oil company, extracts carbon dioxide from natural gas and pumps 2,800 tons of it every day 3,000 feet below the North Sea floor, trapping it in sandstone. A 250-foot-thick layer of shale covers the entire sandstone formation, and it seems to be leakproof. Statoil estimates that all the carbon dioxide emissions from every power plant in Europe for the next 600 years could be stored in the formation.
Of course these promising technologies will translate to added costs to the Utility companies. Consumers, Politicians and Business leaders need to put pressure on the Utilities to start investing in these technologies. This is an issue that requires more legislative and media attention. Unfortunately, Clean Coal has nowhere near the amount of media coverage as Corn Ethanol.

Don't Forget About Conservation
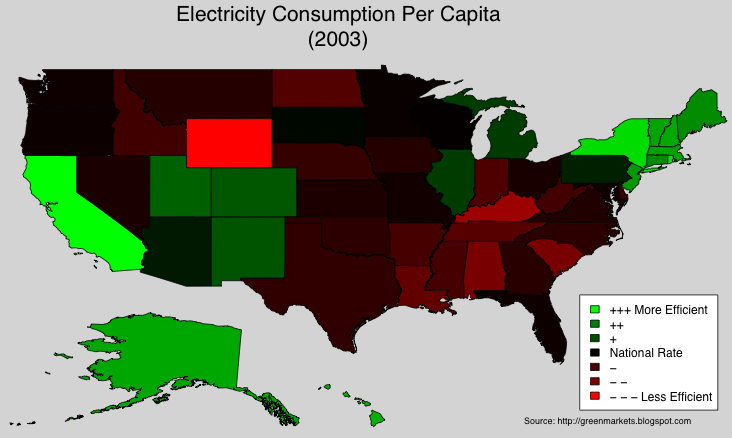
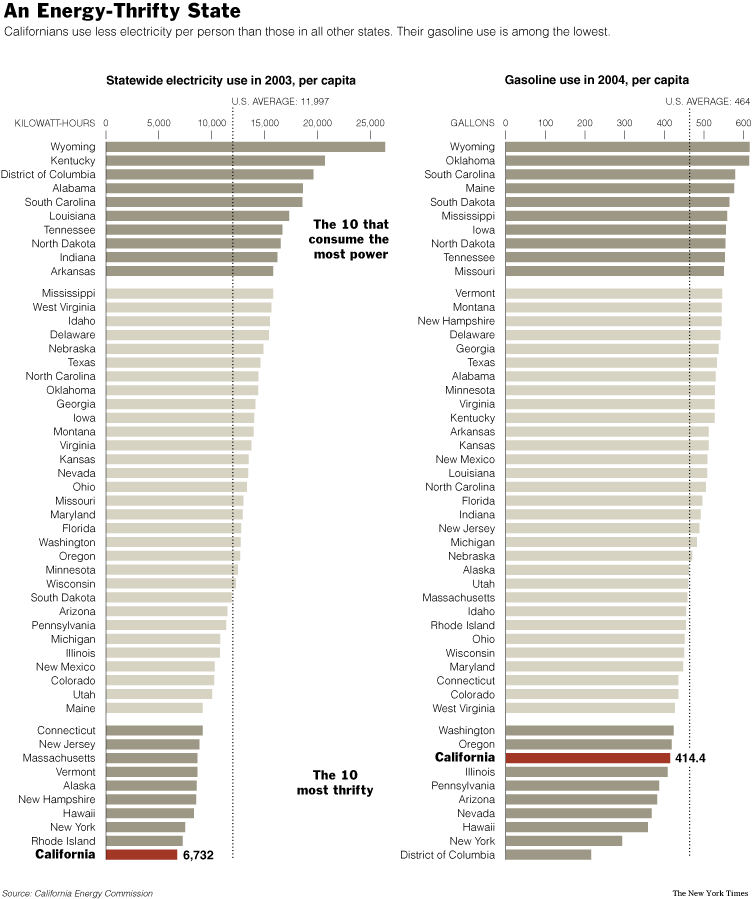
I have consistently argued that Conservation is something we in the U.S. must do more of. We need technologies to produce "clean" energy, AND technologies that drastically reduce the amount of energy we use. Ideally, we would combine technological advances with voluntary reduction in consumption. In a previous post, I highlighted the states that consumed the least amount of electricity per capita:

Besides being blessed with great weather, California is also the one state were bipartisan consensus has led to longstanding conservation programs.

Coal Industry Awakens
Exploiting calls for "energy independence", the coal lobby is pushing coal as another domestic fuel source. A recent article in the Wall St. Journal (subscription required) touched on the critical need to consider global climate change as part of any energy solution:
... Greater use of liquid fuels made from coal, the nation's most plentiful energy source, would reduce reliance on imported oil. But making the liquid fuels and burning them in automobile engines would release additional carbon dioxide, a greenhouse gas thought to accelerate climate change, environmentalists say.
... David Hawkins, a climate-change expert for the Natural Resources Defense Council, says the diesel fuel still contains carbon dioxide, which will be released into the air when it is burned in the engines of cars and trucks. "This issue is the classic example of why you need to have an integrated policy on both global warming and energy," he says.
Finally, to understand the importance of coal in the 2008 Presidential Elections, we note that the swing state of Ohio, and Iowa (the home of the first primaries) have a lot of coal reserves:


Digg It! , Bookmark to del.icio.us , My Yahoo! , ATOM Feed

Monday, January 29, 2007

U.S. CO2 Emissions by Sector and State

Lowering CO2 emissions is increasingly becoming a goal of Corporate America. The CEO's of 10 major corporations are calling on the Bush administration and Congress to pass some " ... serious global warming legislation as quickly as possible." Evangelical Christians, an important constituency inside the Republican party, are also beginning to take environmental issues more seriously. Throw in the 2008 Presidential primaries early next year, and this could be the year of serious global warming legislation.

So what are the primary sources of CO2 emissions in the U.S.? What states and regions have the highest CO2 emissions per capita? I turned to data published by the Environmental Protection Agency (EPA). The EPA data spans 1990-2003, and is broken down by "sector". While composing this post I came across similar data (Wall St. Journal, subscription required) from the International Energy Agency (IEA).

(To enlarge a particular image, click on it.) In the U.S., 33% of CO2 emissions come from the Transportation sector, world-wide, Transporation accounts for only 20%. Americans tend to drive less fuel-efficient vehicles, and tend to drive more miles. Interestingly, while the fast-growing economies of India and China are increasing their share of emissions from the Transportation sector, the U.S. seems to be trending towards less driving, and lighter and more fuel-efficient cars. With the growing popularity of hybrids, bio-diesel, and the possibility of plug-in hybrids, I expect the Transportation sector in the U.S. to see large reductions in the next decade. The other notable difference: the U.S. Residential sector accounts for about 7% of CO2 emissions, compared to 13% world-wide.

Which sectors have shown the fastest growth from 1990-2003? Again we normalize all the time-series, so they start at a common value (say 100), then use their respective year-over-year growth rates to plot the rest of the graph:

From 1990-2003, emissions from the Electric Power and Transportation sectors grew 24% and 20% respectively. Not only are these the largest sources of CO2 emissions (accounting for 71% of total emissions in 2003), they are also the fastest-growing. Policy-makers in the bellwether state of California have long focused their efforts on these sectors, and recently two key initiatives garnered bi-partisan support: utilities must produce 20% of their electricity from renewable sources by 2010 AND refineries and gas stations must reduce by 20% the carbon content of fuel they sell by 2020. As the " ... world's ninth largest emitter of the greenhouse gases that trap heat in the atmosphere", California is ground zero for innovation in renewable energy.

In the U.S., emissions from the Industrial sector declined by 5% from 1990-2003. This drop is probably a reflection of the fact that the U.S. manufacturing sector has declined significantly during that time period.

Finally we use heat maps to present state level emissions. To account for the size of a state, we compare emissions-per-capita. Our benchmark will be the U.S. per capita emissions: Green means a state has lower per capita emissions than the U.S., Red means it has higher emissions per capita.

In 2003, Wyoming had the highest TOTAL CO2 emissions per capita. The above map is somewhat reminiscent of the 2004 Presidential Electoral College map :-)

Next we examine state level emissions data for the two largest sources of CO2 emissions in the U.S. (Electric Power and Transportation).

The Western states rely more on hydro-electric power compared to the rest of the country. The "red" states are most likely those that lean heavily on coal powered plants. In a previous post, I highlighted the fact that California used the least amount of electricity per capita. In the graph below, we look at a simple linear relationship, between electricity consumption per-capita AND per capita CO2 emissions due to electric power:

WY, ND, WV are states whose per capita CO2 emissions are high relative to their per capita electricity consumption. These are states whose electric power comes largely from coal powered plants.

Turning to the Transportation sector:

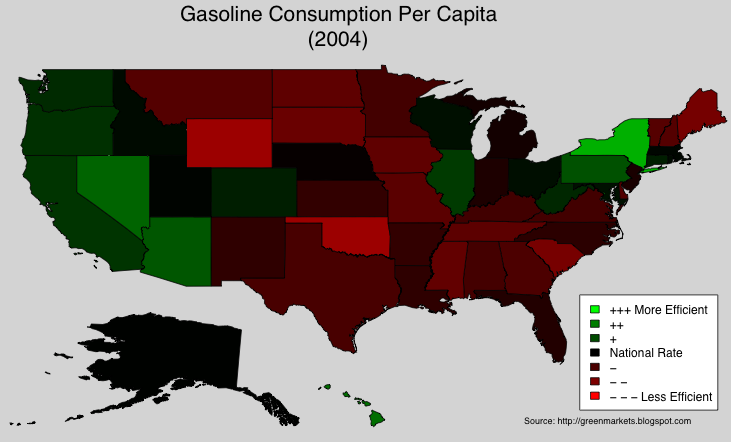
We expect California (home to over 1 in 10 new cars sold in the U.S.) to be about average, and the Northeast (home to mass transit) to have less emissions per capita. In a previous post, I noted that California is among the states that used the LEAST amount of gasoline per capita (here is a map). Below is a scatterplot of 2004 Gasoline consumption per capita vs. 2003 CO2 Emissions from Transportation. Unfortunately, data for the variables represent two different years:

Using this "weak" linear relationship, we uncovered some interesing outliers: AK, WY, and to a lesser extent HI and LA. These states have CO2 emissions (from Transportation) higher than what one would expect from their repective per capita gasoline consumption. AK is a huge state, and transportation between some areas is limited: to get to the state capital you have to fly or take a ferry! I suspect that gasoline consumption-per-capita is largely based on data from gas stations, while the Transportation emissions-per-capita captures more forms of transportation.

Sound energy policy pays off relatively quickly. Consider the case of California:


Power use per person has remained roughly stable in the state since the 1970s, even as it has doubled in the rest of the country (see chart above). As a result, California's greenhouse-gas emissions per person are on a par with those of Denmark. Relative to the size of its economy, they are lower.
In the next few weeks, I will try to focus on the Transportation and Electric Utility sectors: the reasons behind the high amounts of emissions, and the solutions currently being developed.

UPDATE: The SJ Mercury News has a great article on the steps California took to become the most energy efficient state in the US.

Digg It! , Bookmark to del.icio.us